1. Feature Overview
Linked Insights lets you connect a source report to a target report on Analytics Report Builder. When a user clicks a measure value in the source, the target report opens with matching dimension context and filters applied automatically.
Unlike drill down, which is limited to the source report’s own data source, Linked Insights can point to any report you have access to. Each measure can be linked to a different target report.
Linked Insights is useful when you want to:
- Navigate to a report with a different data source on click (for example, from a Leads measure to an Opportunities report).
- Link each measure in a summary report to a different target report, so each number opens the most relevant view.
- Navigate into another summary report instead of a flat tabular list, preserving the summarised structure.
Linked Insights vs Drill Down
| Option | Behaviour |
|---|---|
| Drill Down | Shows detailed rows from the source report’s own data source. Limited to columns from that data source only. |
| Linked Insights | Opens a separate target report with matching dimension context and filters applied. The target can use any data source and any visualization type. |
2. Prerequisites
- Analytics is a paid feature. To enable it for your account, contact your account manager or support@leadsquared.com.
- You must have access to both the source report and the target report.
- The target report should include the same dimension you want to map from the source, so filters can carry across correctly.
3. Configuring Linked Insights
3.1 Use Case
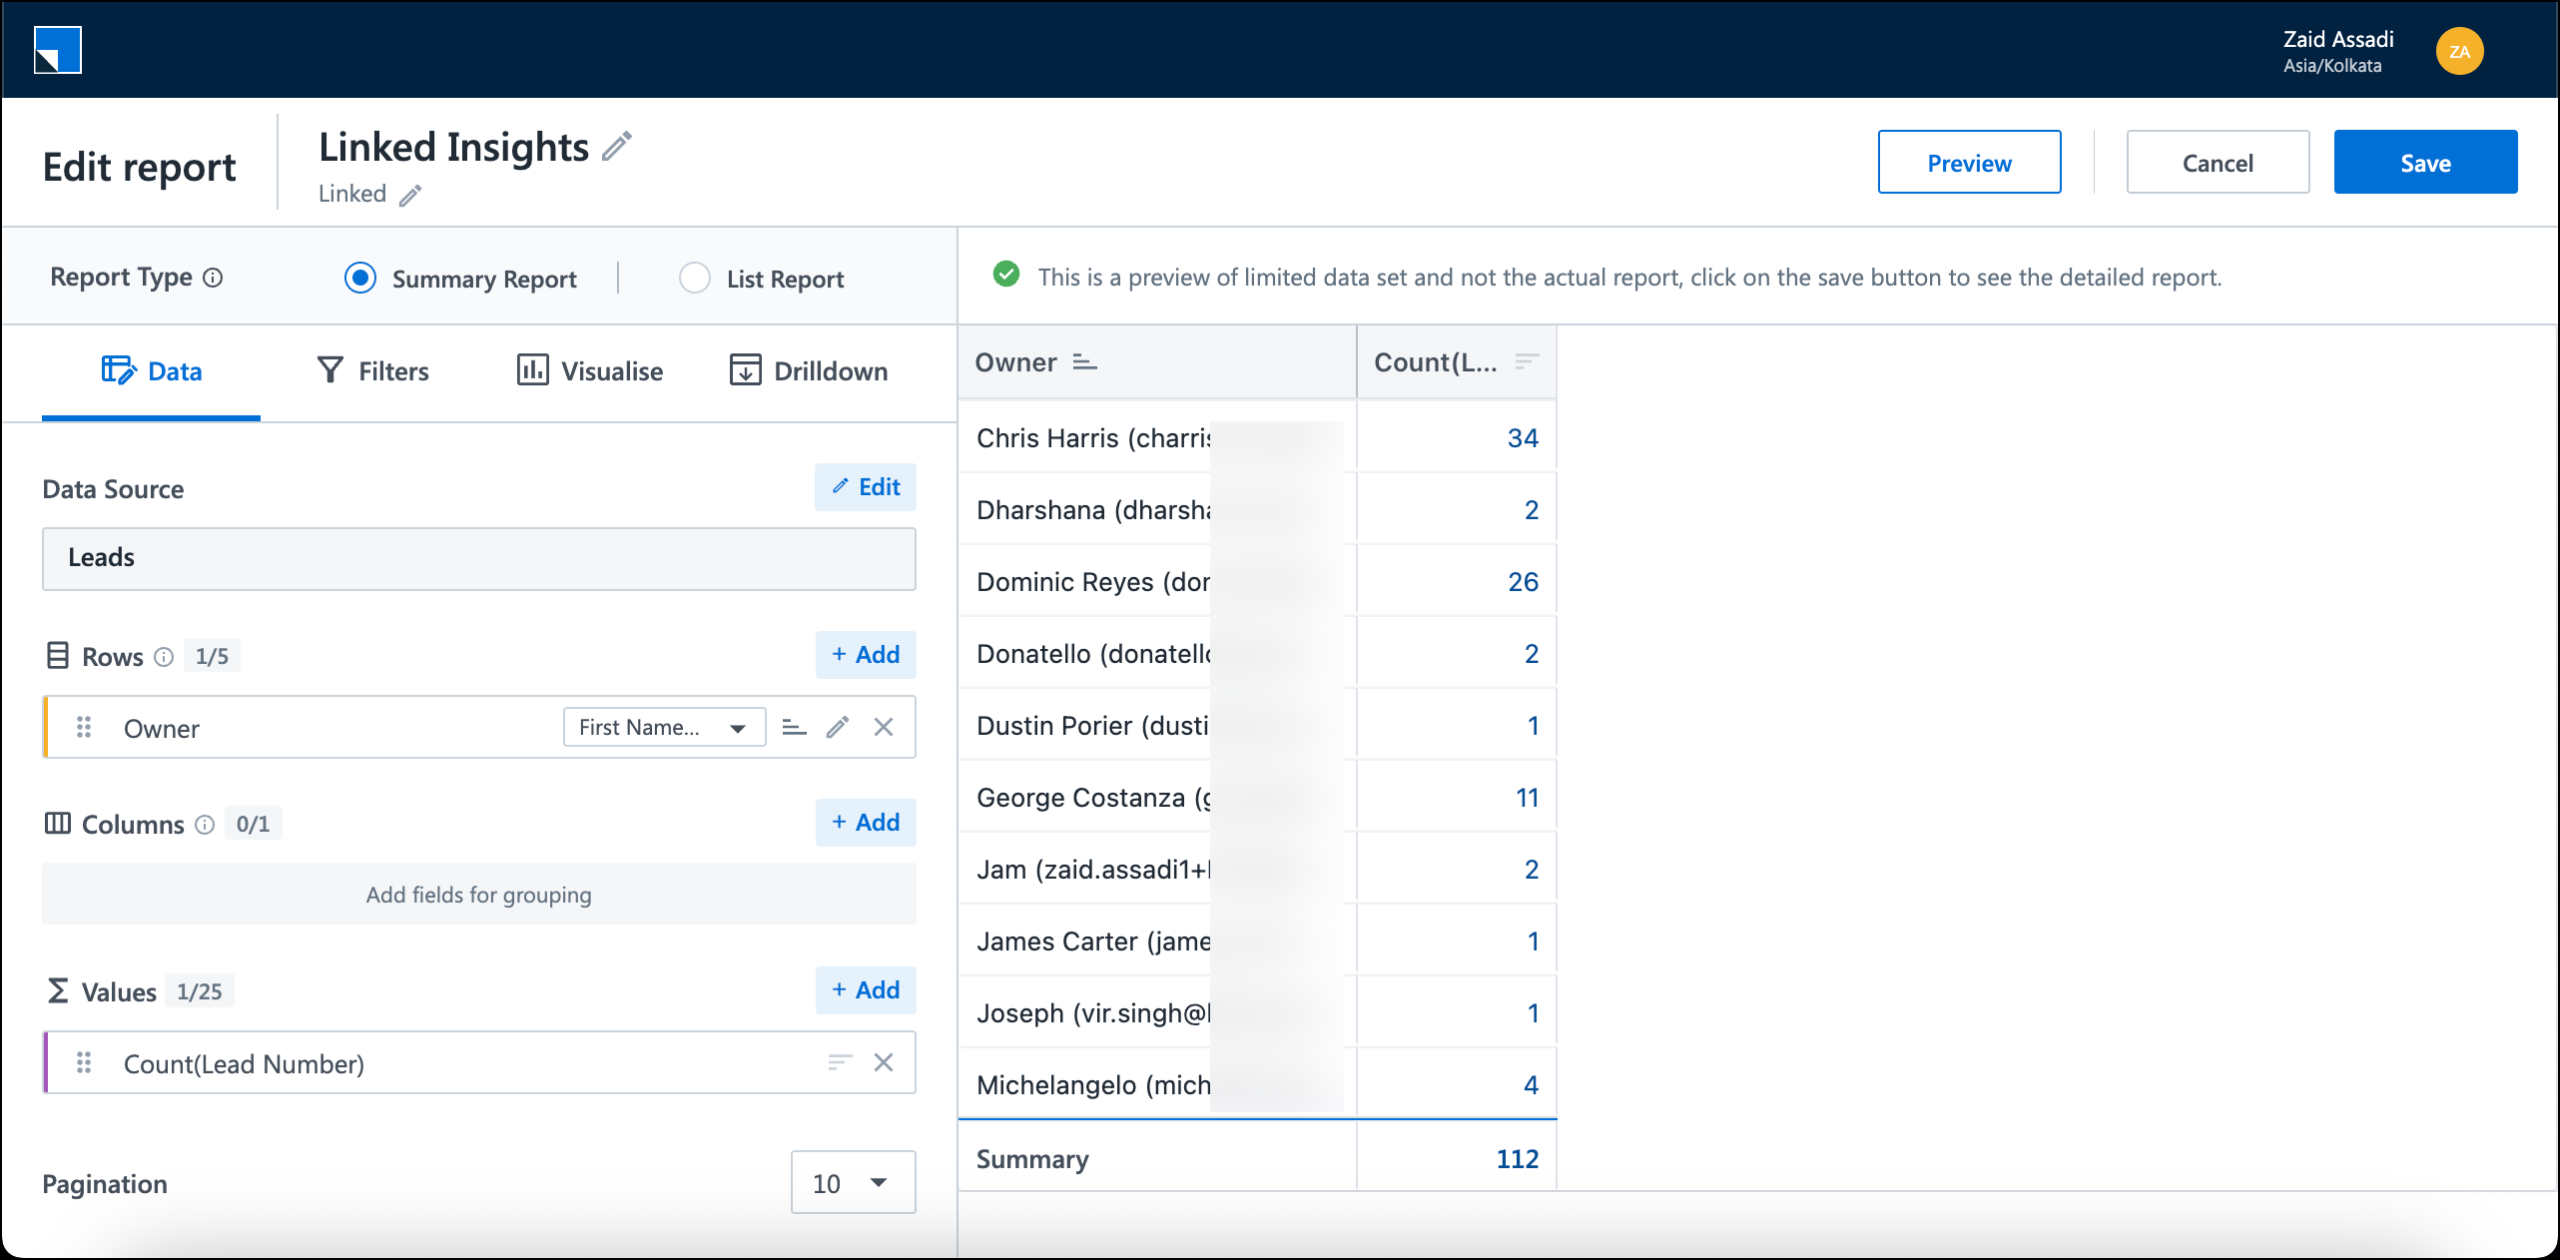
You have a summary report showing the count of leads grouped by Lead Owner. When a user clicks a count, you want to open a separate activity count by leads report filtered to the same owner, instead of showing a drill down list within the source report.
Step 1: Create the source report
- Open the Report Builder and create a summary report.
- Select your data source (for example, Leads).
- Add a dimension (for example, Lead Owner) and a measure (for example, Count of Leads).
- Save the report.
Step 2: Linked Insights configuration
- In the Report Builder, go to the Drilldown tab.
- Alongside the existing drill down configuration, you will see the Configure Linked Insights option. Select it.
- Click + Add to create a new linked insight entry.
- Under Select Value(s), click +Add choose one or more measures that should trigger the link on click.
- Under Select Report to Link, pick the target report from the dropdown.
- Once selected, the Dimension Linking and Filter Linking sections appear.
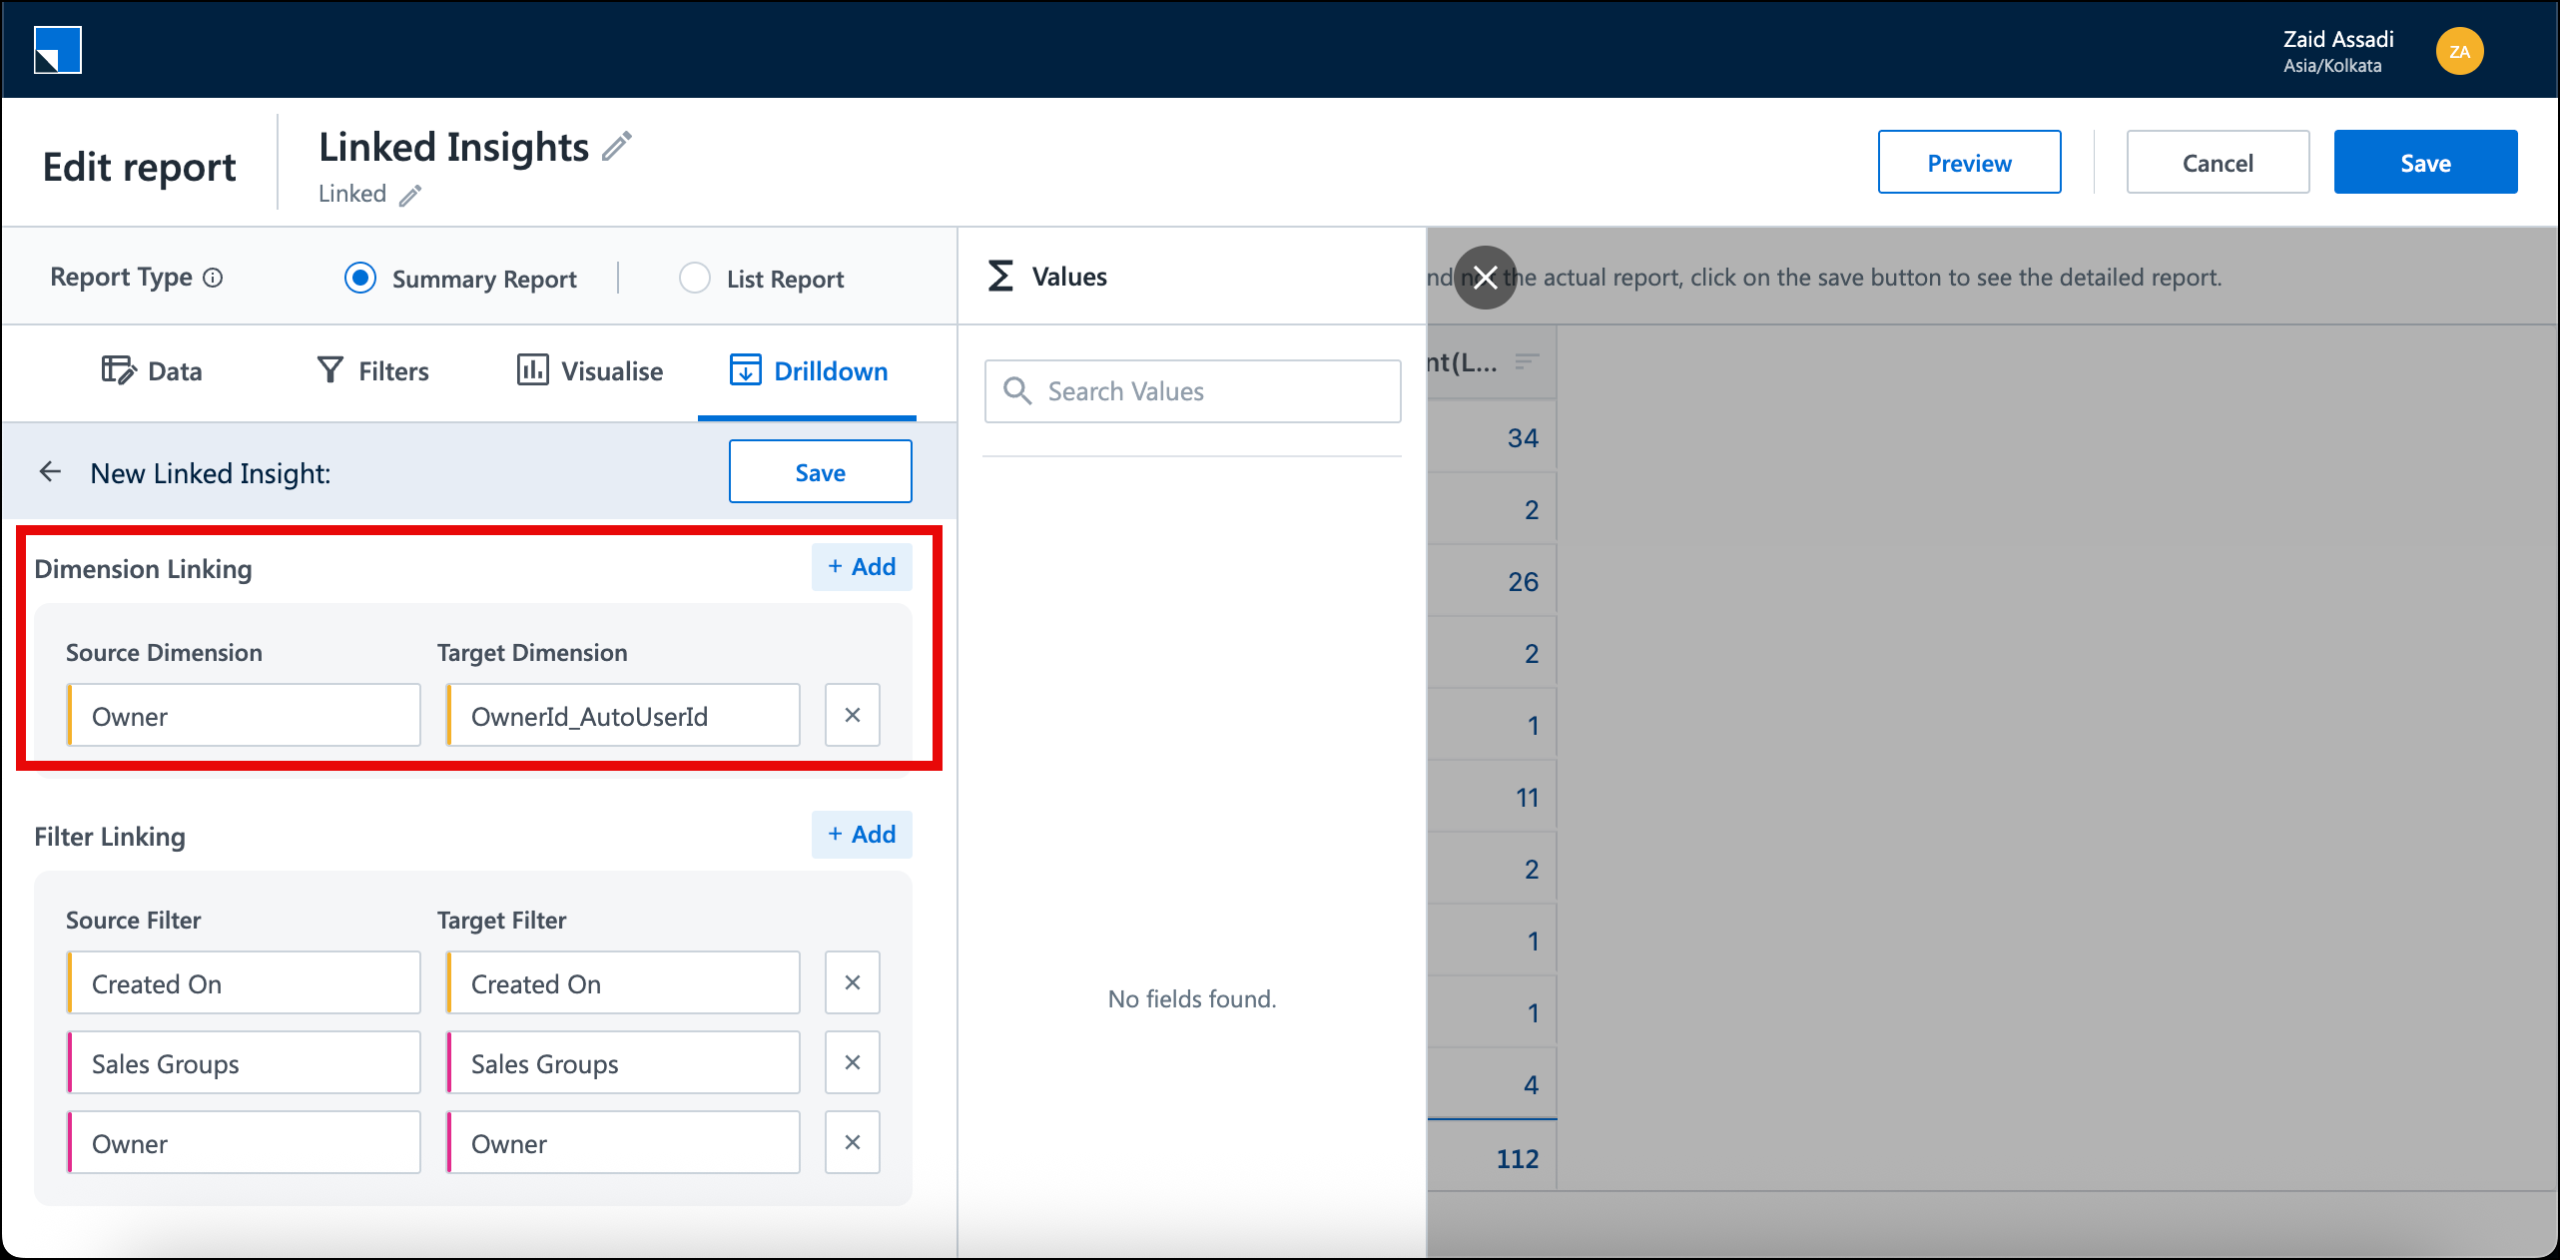
Step 3: Configure dimension linking
Dimension linking maps a dimension in the source report to the matching dimension in the target report, so the target is filtered by the value you click.
- Under Source Dimension, select the dimension applied in the source report (for example, Lead Owner).
- Under Target Dimension, select the matching dimension in the target report.
- Add additional dimension mappings if your source report uses more than one dimension.
Linked Insights supports one-to-one dimension mapping. For example, Source Dimension “Activity Owner” can map to Target Dimension “Activity Owner”.
Example
The source report groups Count of Leads by Lead Owner:
| Lead Owner | Count of Leads |
|---|---|
| Sachin | 32 |
| Priya | 47 |
| Rahul | 18 |
Map Source Dimension: Owner to Target Dimension: OwnerId_AutoUserId.
When the user clicks 32 next to Sachin, the Activity Count by Leads report opens showing only the activity counts for Sachin’s 32 leads — not all leads in the system. The same applies for the other rows.
Linked Insights supports one-to-one dimension mapping. Source and target dimension names do not need to match exactly, as long as they represent the same field (Owner and OwnerId_AutoUserId, in this example).
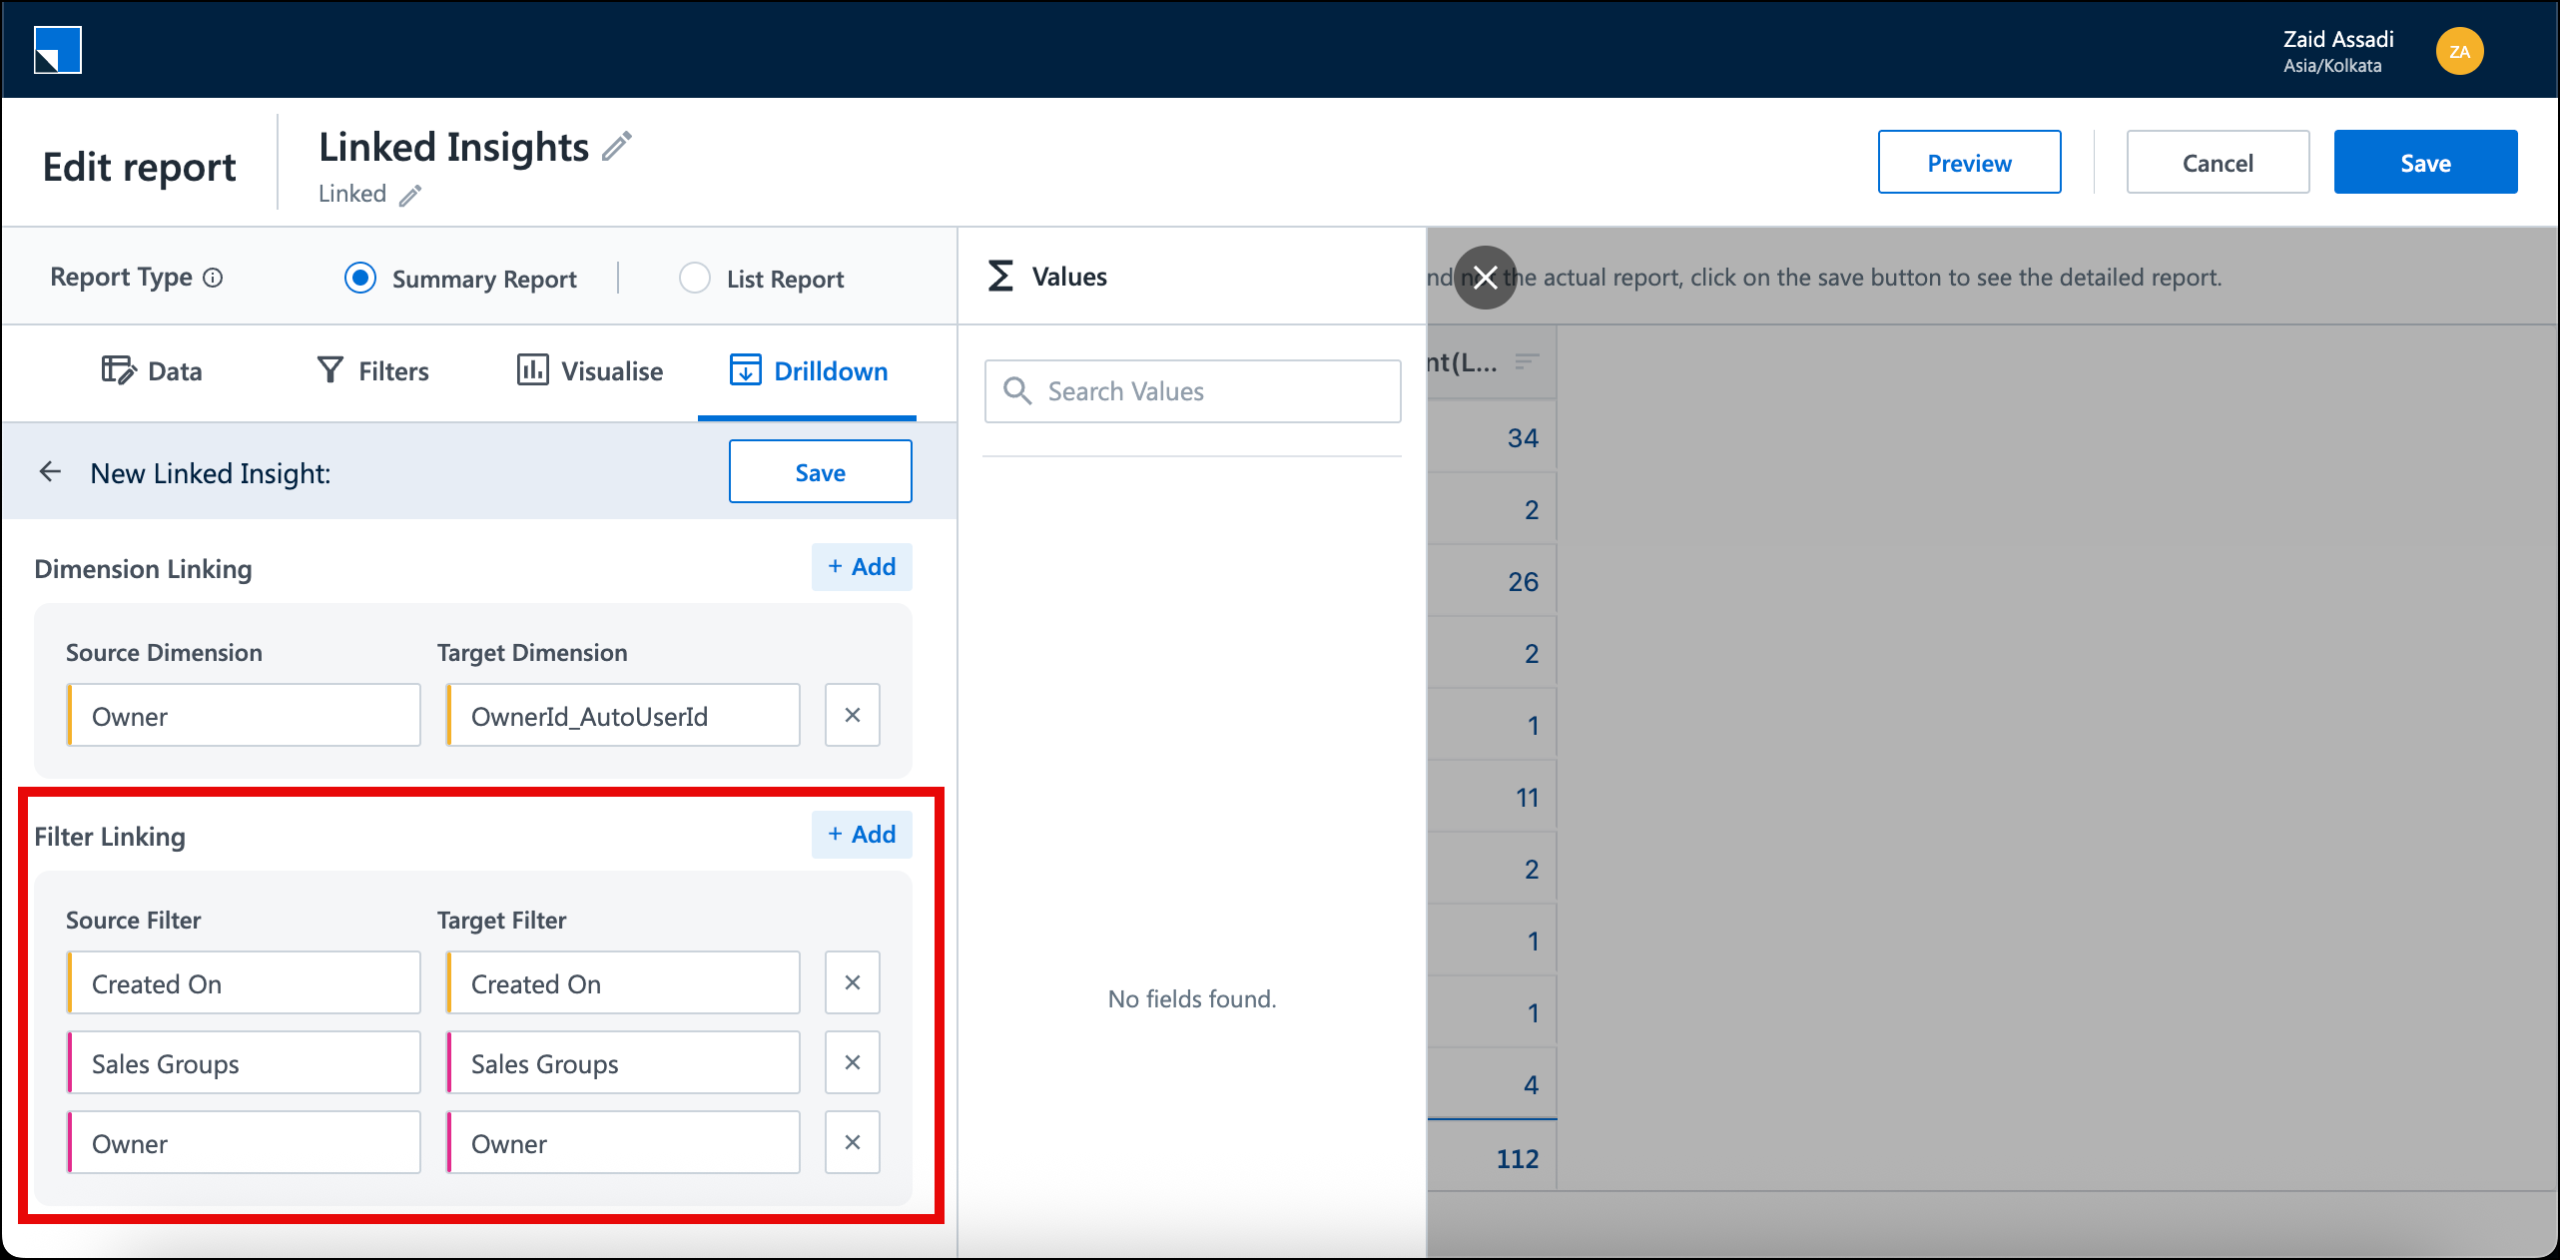
Step 4: Configure filter linking
Filter linking carries report-level filters from the source into the target, so both reports stay in sync.
- Review the filters listed under Filter Linking.
- Map source filters to the corresponding target filters.
- At a minimum, apply the owner and date filters so the target report reflects the same scope as the source.
Note: Dependent filters (such as user filter, sales group, and level of sales hierarchy) are carried over only if the filter names match between the source and target reports. Mismatches are not resolved automatically — configure the target report with the same filter set to avoid gaps.
Example
Continuing from the source report (Count of Leads by Owner) and the target report (Activity Count by Leads), the source report has these filters applied:
- Created On
- Sales Groups
- Owner
Map each filter to its counterpart on the target report:
| Source Filter | Target Filter |
|---|---|
| Created On | Created On |
| Sales Groups | Sales Groups |
| Owner | Owner |
When the user clicks 32 next to Sachin, the Activity Count by Leads report opens with Owner = Sachin (from the dimension click), plus the Created On, Sales Groups, and Owner filter values carried over from the source. The result matches the exact scope of the 32 leads seen in the source.
If filters are not mapped, the target report uses its own default filter values, which may return a different record count.
Step 5: Save and test
- Click Save on the Linked Insights entry.
- Save the source report.
- Click a measure value in the source report. The target report opens in a new tab, filtered to match the clicked value and the source report’s filters.
Note:
- Linked Insights carries over dimension context and filters only. Visualization settings are not copied from the source to the target report.
- When a target report is opened through a Linked Insight, the Save As, Edit, Copy Embed URL, and Delete actions are not available on it.
- If you refresh the target report URL more than 1 minute after opening it, the report will fail to load because the temporary state expires. To re-open it, return to the source report and click the measure value again.
5. Configuring Multiple Linked Insights
If your source report has more than one measure, each measure can point to a different target report.
For example, on a User Productivity report with measures for Logins, Leads, Activities, and Tasks:
- Count of Logins can link to a Login Activity report.
- Count of Leads can link to a Lead Distribution report.
- Count of Activities can link to an Activity Summary report.
- Count of Tasks can link to a Task Completion report.
To add another Linked Insight, click Configure Linked Insight again and repeat the configuration.
Note:
- Report chaining is supported. A target report can itself be configured with its own Linked Insights, allowing navigation from one report to another and onwards (for example, Report A → Report B → Report C).
Any Questions?
Did you find this article helpful? Please let us know any feedback you may have in the comments section below. We’d love to hear from you and help you out!