


Get Started
Sales Suite
Field Ops
Marketing
Service CRM
Integrations & Apps
FloStack
How to read Lead Distribution Analysis (3 dimensional)
LeadSquared provides powerful analytics around marketing and sales to help you fine-tune your business processes. Now we have added one more report to make you understand how Lead Distribution happens in your account.
This report is accessible Reports -> Lead Insights -> Lead Distribution Analysis – 3 fields .
This report works on based on 3 fields as explained below
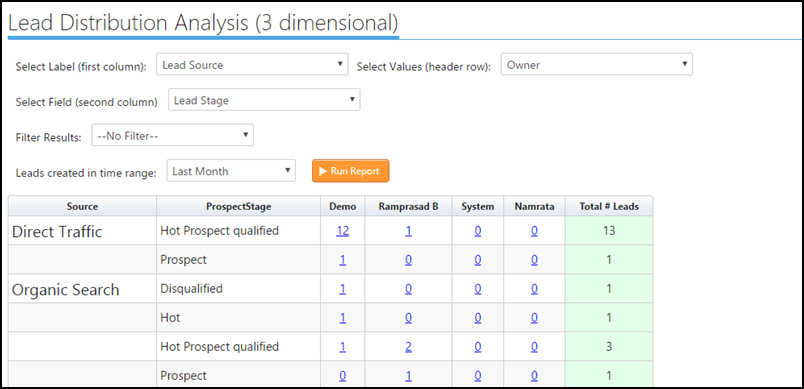
Select Label (First Column ) – The Lead field which you select will be displayed in the first column of the report, in the above image, I have selected Lead Source.
Select Values (header row) – The Lead field selected will be displayed as a row header of the report, the data will be split based on the field which you have selected in this section. In the above image, I have selected Lead Owner field.
Select Field (Second Column) – The Lead filed selected here will be used to further classify the number of leads . Example : in the above image I have chosen Source as 1st column and Lead Stage in the second column, where the report now gives you a report In Lead Source for a particular Lead Stage how many leads have been distributed for the Owners.
Filters – Can be used if you wish to filter the data on specific criteria.
Lead Created in time Range -Used to filter the leads based on their created dates. In the above image, I have selected last month, so the report will show the lead distribution for only those leads which were created last month.
Hope this report solves your Lead Distribution question.
What if the lead stage is appeared in the wrong order? As per the above table, how could I swap the order between hot and hot prospect qualified? What is the logic in picking up the order? Thanks.
Hi, Phat.
You can click on the column header to reorder the lead stage. However, for a better user experience, we suggest you check out SIERA Reports.