


Get Started
Sales Suite
Field Ops
Marketing
Service CRM
Integrations & Apps
FloStack
How to Use Landing Page Reports?
Analyzing your Landing Page Report is one of the most important aspects in the process of Lead Management. You can use the landing page report to study the success/failure of the landing page through various metrics available in the report.
This article helps you understand the various metrics and parameters of a Landing Page Report.
Prerequisites
- You have logged into LeadSquared.
- You are an Admin or Marketing User of your LeadSquared account
- You have created and published the landing page of which you want to study the report.
Procedure
1. Navigate to Marketing > Landing Pages to see the list of all the landing pages you have created in your LeadSquared account.
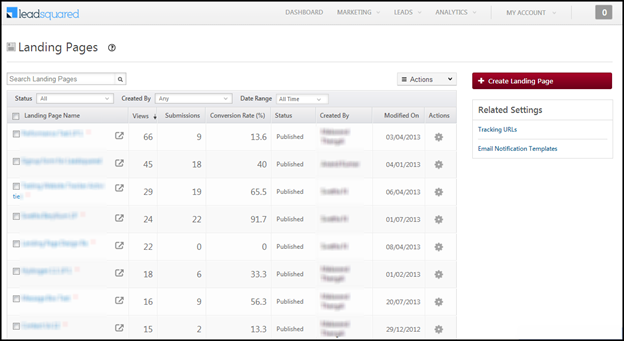
2. Click on the Landing Page Name to view its Report. You will be redirected to its Report page.
Note: You can view the Report of a Landing page only if it is in Published state.
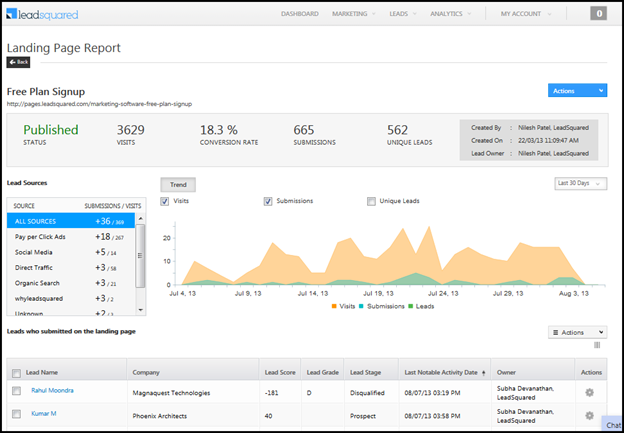
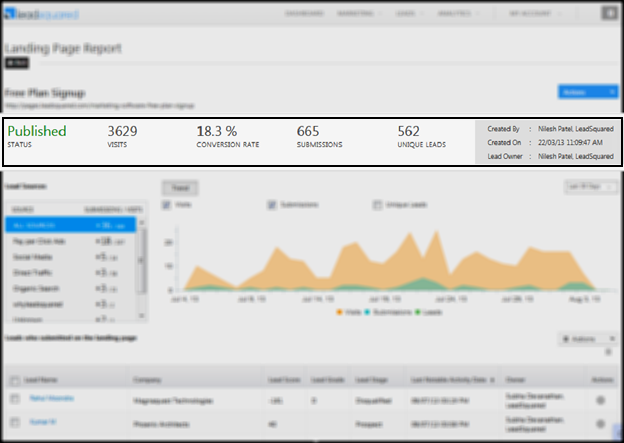
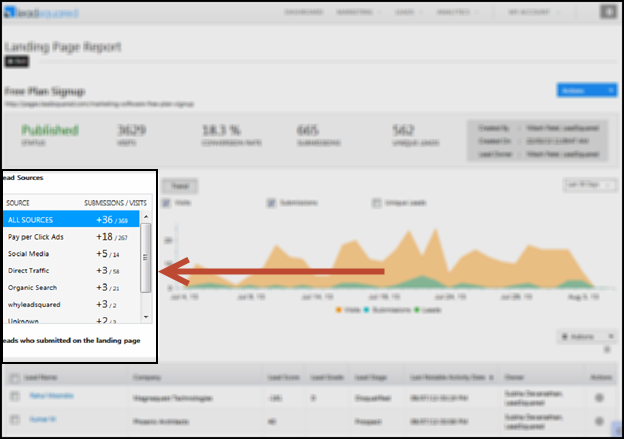
3. You can view the Status of the Landing Page, the number of Visits, Conversion rate, the number of Submissions and the number of Unique Leads at the top of the report.
- Conversion Rate: This is the number of visitors on your landing page who submitted their details and thereby became leads. Their information will be captured in your LeadSquared account. This gives a fair idea about the success of your landing page. If the conversion rate is too less, then you may consider improving the design, changing the content, or even replacing the landing page.
- Unique Leads: This is the number of new leads that submitted their information on the landing page. The leads who are already in LeadSquared will not be updated again since they will result in duplication. Hence unique leads gives you an exact picture of the recent leads which have submitted on your landing page.
4. The graphs in the landing page illustrate the number of visits, submissions and unique leads. You can choose to view these trends on a daily, weekly, monthly and yearly basis. You can also view graph in any custom time span. You must click on Custom and select the From and To dates.
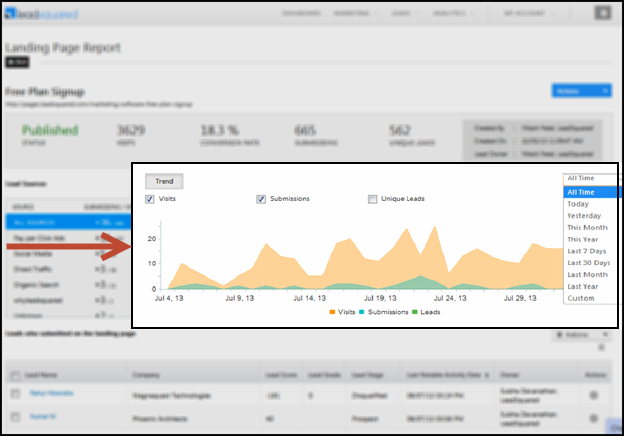
5. You can view the graphical representation of the views and submission on the basis of Lead Sources. You can select any of the available lead sources and view the graph. This way you can analyze the lead details according to the source and look to improve the source in which the leads obtained are less.
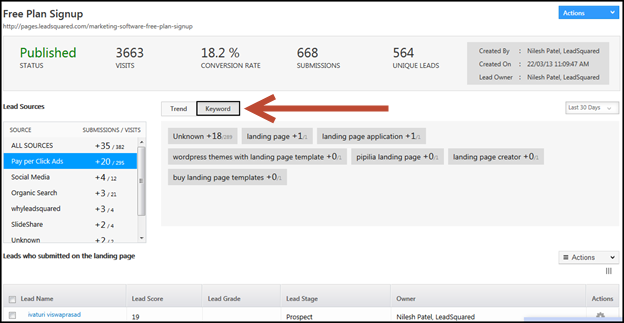
5. You can also view the keywords entered by users through which they were redirected to your landing page. You can view the keywords when you click on Pay Per Click Ads and Organic Search in the lead source tab. Click on the Keyword button in the graph display area. By analyzing the keywords, you could include or exclude terms on your landing page to make it more relevant and searchable.
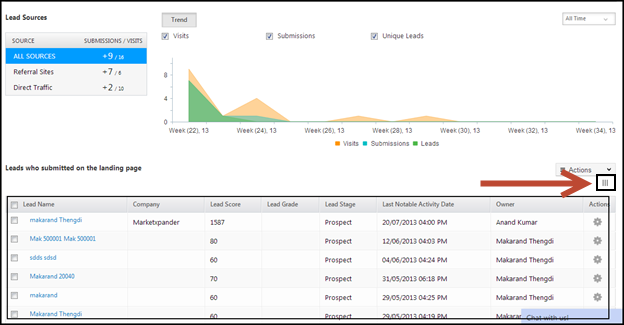
6. You can view the lead list for the respective lead source below the graph. If you select All Sources in the lead source tab, you can view the list of all leads irrespective of the lead source. You can choose which lead detail you want to view by clicking on the Select Columns button (shown in the screen shot below).
You can perform the following actions to the lead details
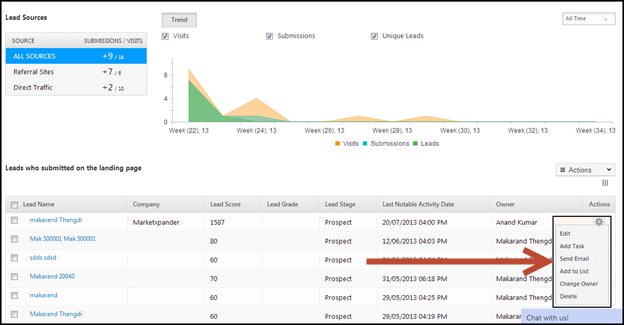
- Edit: This allows you to edit the lead details. You can edit any of details available in the Edit Lead window.
- Add Task: This allows you to create a task in relation to the particular lead. You can add any task in the Create Task window.
- Send Email: This allows you to send a quick one to one email to the lead. In the Send Email window you can compose an email and include any variable that you require.
- Add To List: This allows you to add the lead to an existing list or add it to a new list, by creating one in the Add to List window.
- Change Owner: This allows you to assign an owner to the lead. By default the logged in user will be the lead owner.
- Delete: This allows you to delete the lead details from LeadSquared.
What is the difference between “View All Submissions” and “View Submissions by Source” in the Landing Page report?
- “View All Submissions” includes all form submissions, even from leads that have been deleted.
- “View Submissions by Source” only displays submissions from leads that currently exist in the account.
This difference in criteria can result in varying submission counts between the two options.