1. Feature Overview
You can now import external data stored in Mavis into SIERA and use it in your SIERA reports and dashboards. This enhancement allows you to combine third-party campaign data (e.g., from Facebook Ads, Google Ads) with your LeadSquared data for deeper performance insights.
2. Prerequisites
- SIERA is a paid feature. To enable it for your account, contact your account manager or support@leadsquared.com.
- Syncing data on Mavis with SIERA is not enabled by default. To enable it, contact support@leadsquared.com.
- For more information on building a SIERA report, refer to SIERA Report Builder.
- For more information on building a SIERA dashboard, refer to SIERA Dashboard Builder.
3. Use Case
Suppose you run marketing campaigns on platforms like Facebook or Google Ads and want to analyze them in SIERA alongside your lead and opportunity data.
With this feature, you can:
- Import campaign performance data into Mavis.
- Select the required fields to sync into SIERA.
- Build reports or dashboards in SIERA that merge Mavis data (impressions, clicks, spend, etc.) with your CRM data (leads, opportunities, stages, etc.).
4. Prepare Data in Mavis
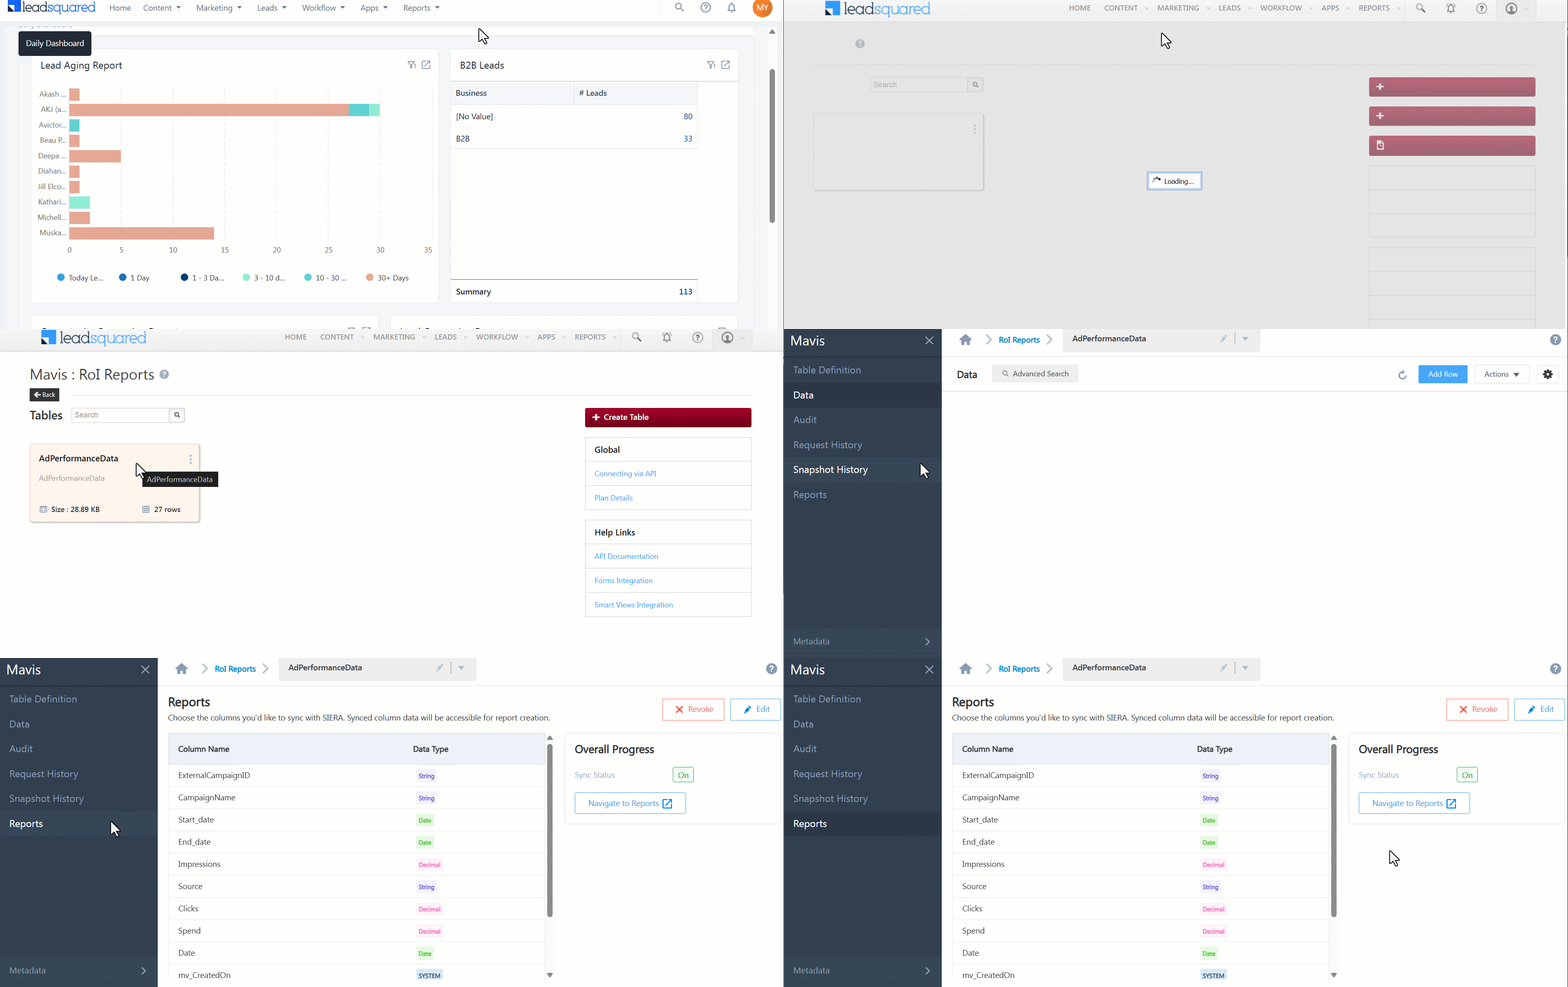
- In Mavis, navigate to the database and select a table.
- Go to the Reports section.
- Choose the columns you want to sync with SIERA (e.g., Campaign Name, Start Date, End Date, Impressions, Clicks, Spend). Synced column data will be accessible for report creation.
- Save your selection.

5. Import Mavis Data into SIERA
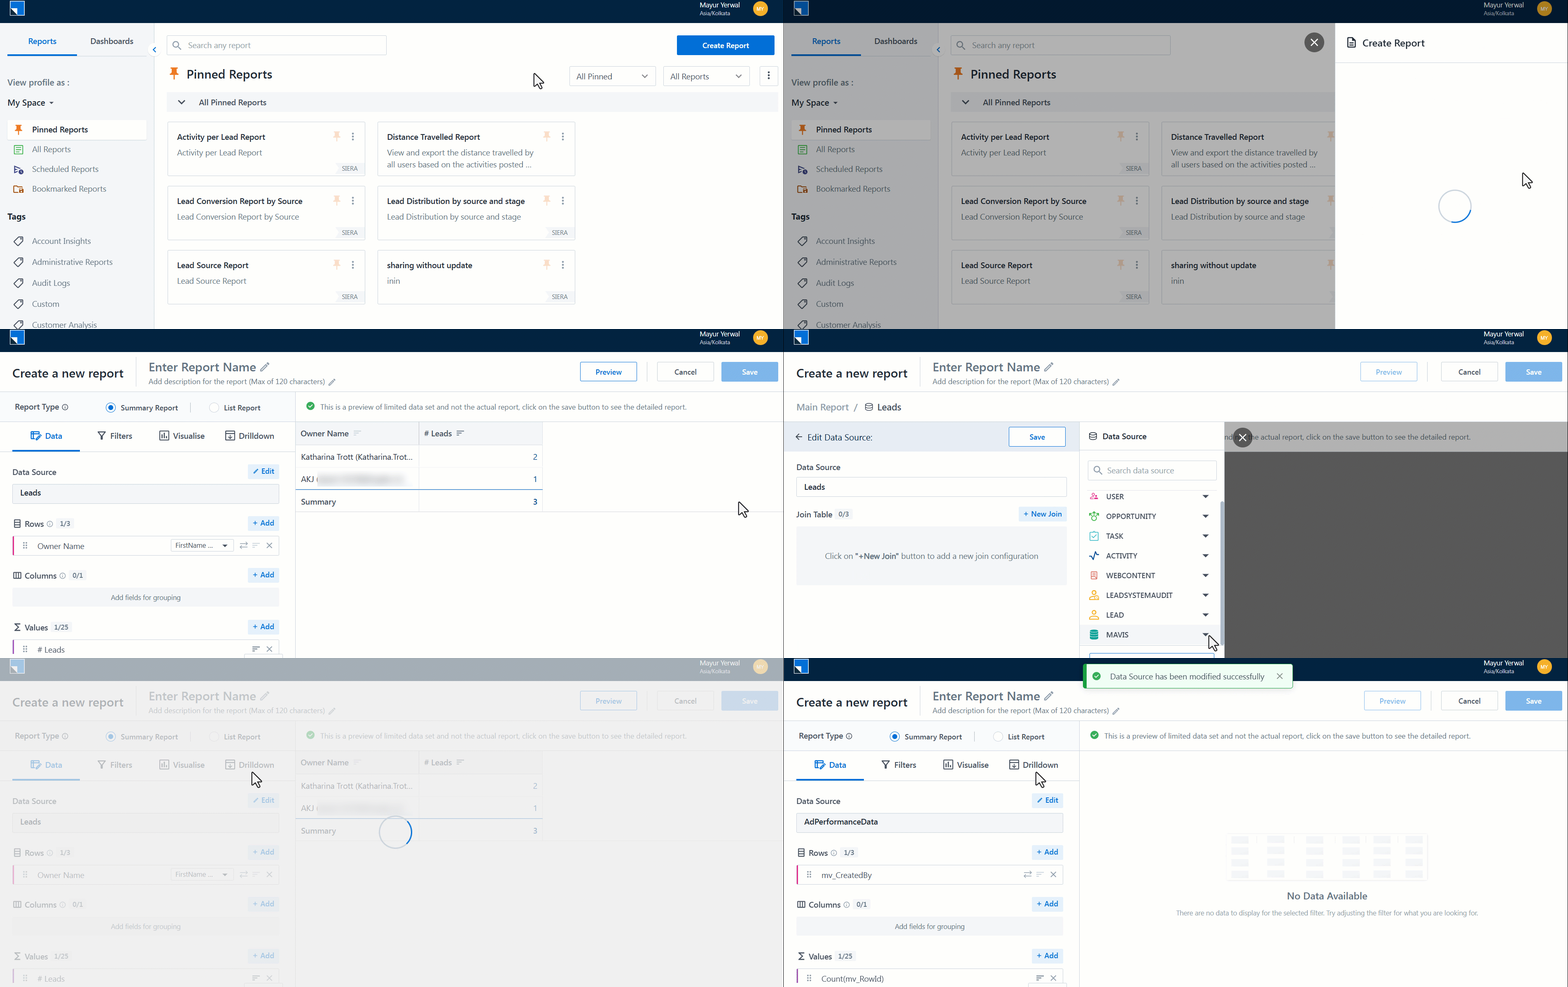
1. Navigate to SIERA.
2. Create a new Report (or edit an existing one).
3. In the Data Source selector, locate the Mavis section.
4. Select the relevant dataset (e.g., Ad Performance Data).
5. The chosen fields from Mavis will appear as available columns for your report.

6. Build the Report
Example Scenario
You’ve imported Facebook Ads campaign data into Mavis with fields for Campaign Name, Impressions, Clicks, and Spend. Now, you want to build a summary report to calculate CTR (click-through rate) and CPC (cost per click).
Follow these steps –
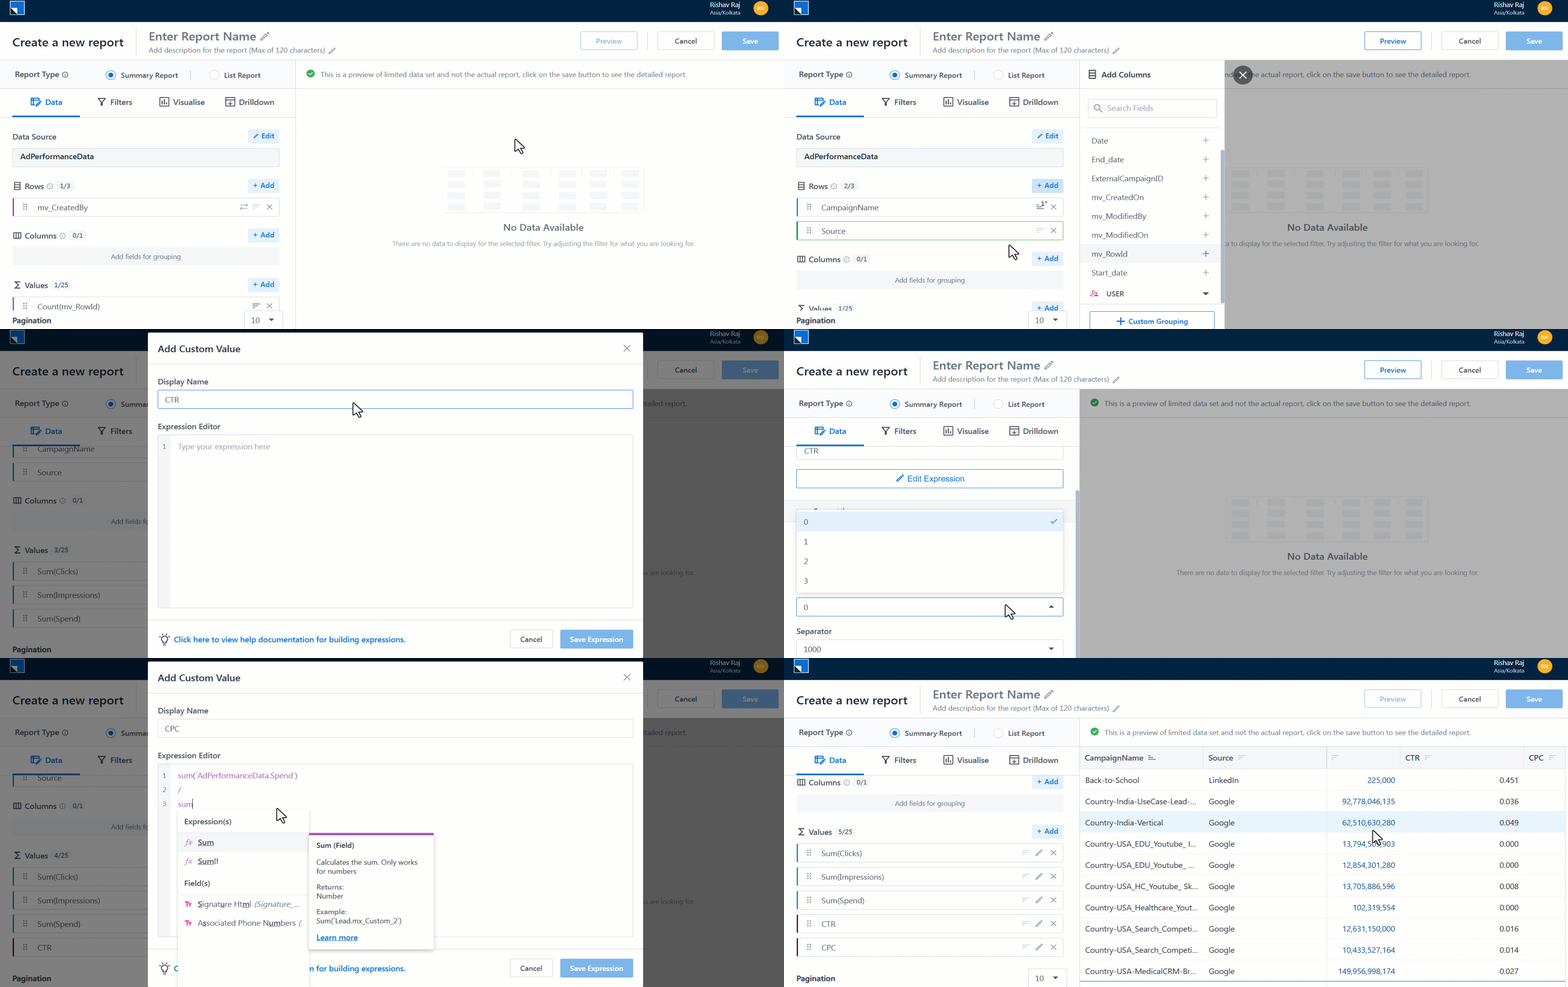
- Add the required rows (e.g., Campaign Name, Impressions, Clicks, Spend).
- Create calculated fields for KPIs, such as:
- Click-Through Rate (CTR) =
Sum of Clicks / Sum of Impressions - Cost Per Click (CPC) =
Sum of Spend / Sum of Clicks
- Click-Through Rate (CTR) =
- Format numeric fields (e.g., set decimal places as needed).
- Preview the report.

7. Create Dashboards
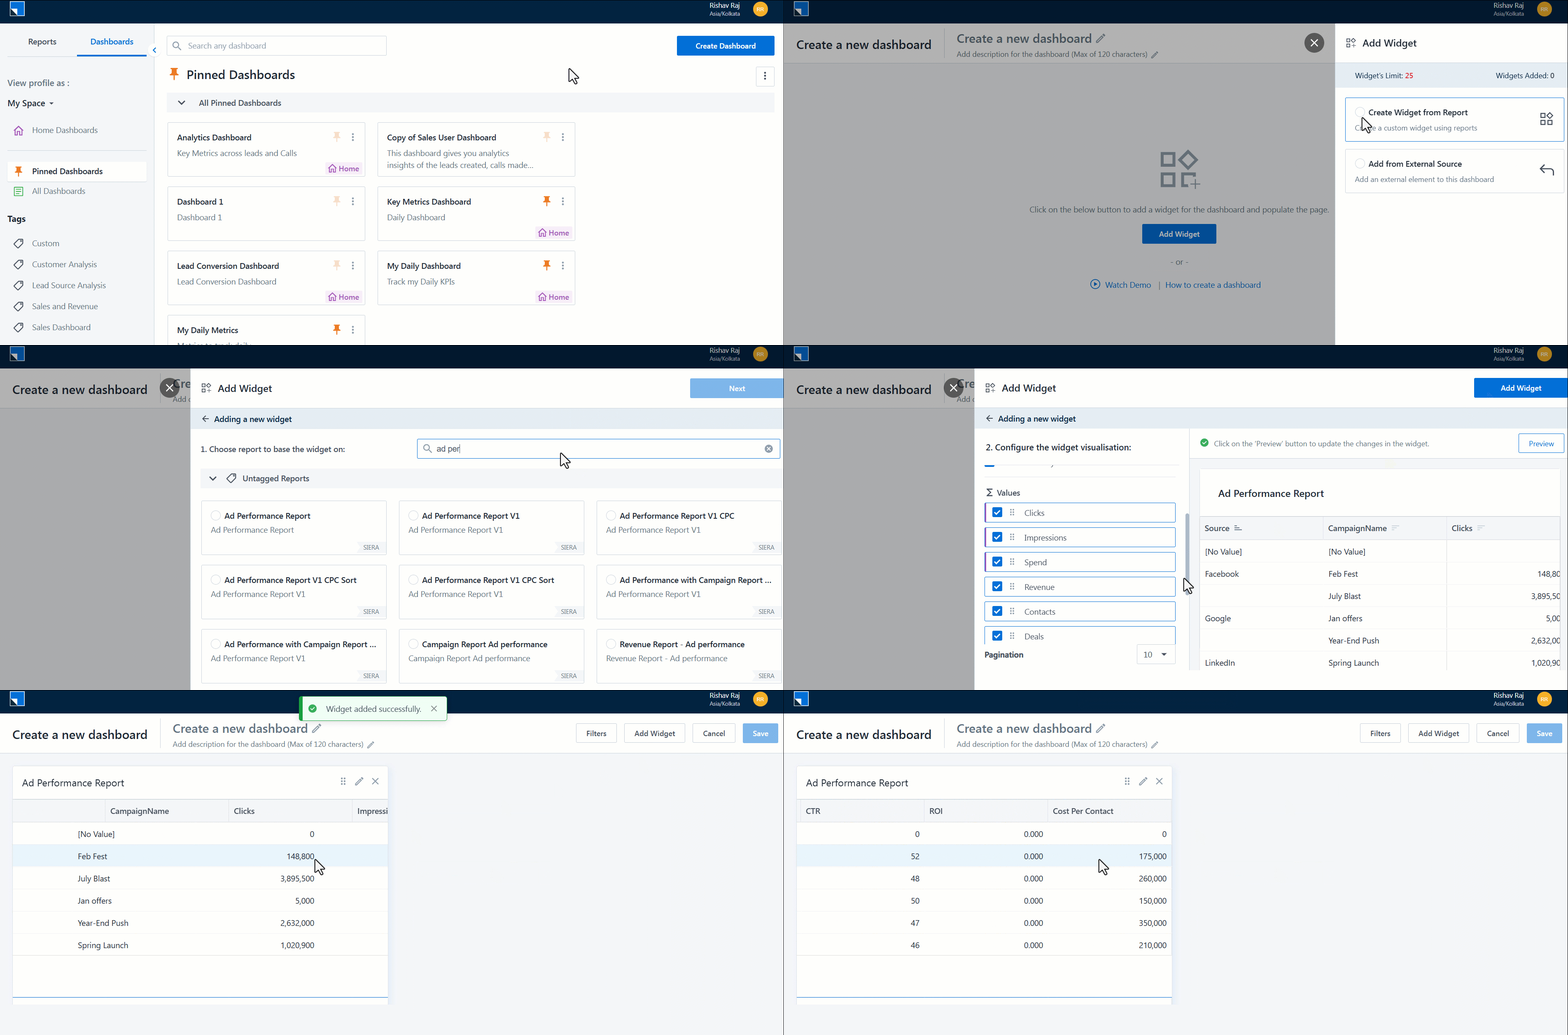
Once the report is ready and saved, you can add it to your SIERA dashboard.

FAQs
1. What types of external data can I bring into SIERA through Mavis?
Any data you can store in Mavis (For example, ad performance metrics from platforms like Facebook Ads, Google Ads, or other marketing tools).
2. Can I use this with both Summary and List reports?
Yes. However, KPI calculations and aggregations are available only in Summary reports.
3. How often is the data refreshed?
Data availability depends on the Mavis sync schedule for your connected sources.
Any Questions?
Did you find this article helpful? Please let us know any feedback you may have in the comments section below. We’d love to hear from you and help you out!


