

Analytics Updates | September 2026

Period Comparison and Trend Indicators
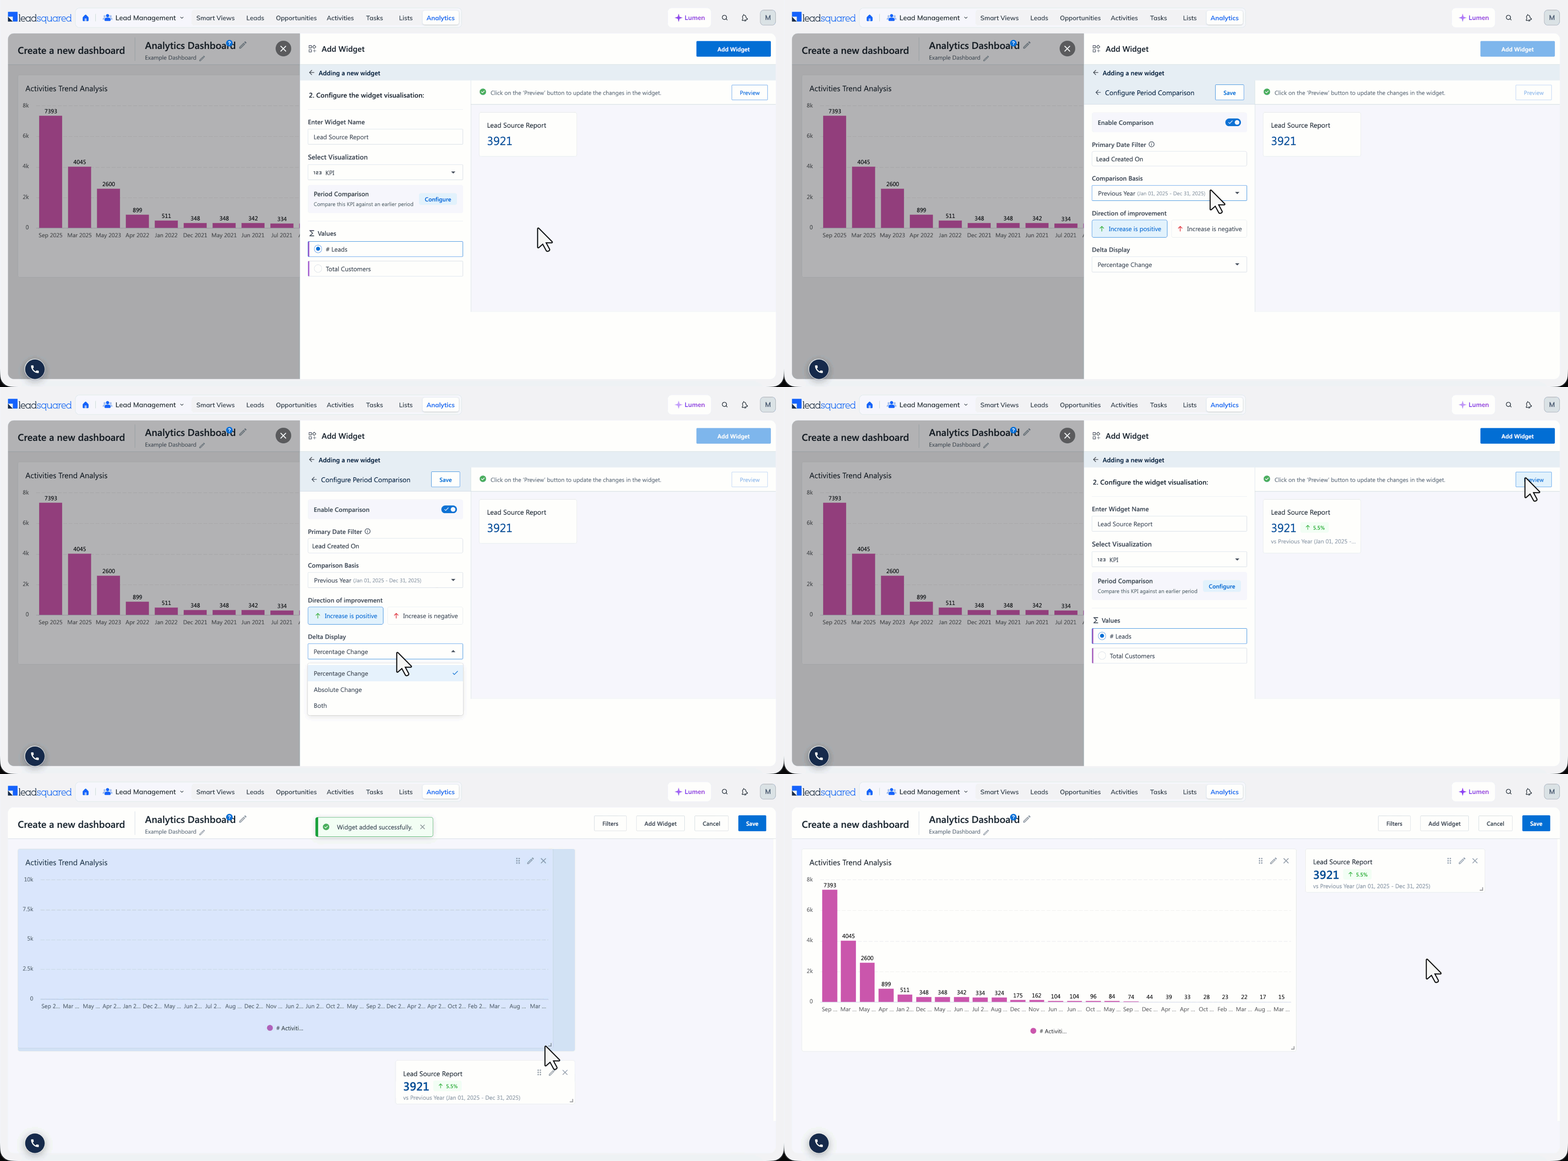
A KPI widget previously showed a single number with no reference point, so a strong month looked identical to a weak one. Dashboard editors can now attach a comparison period to any KPI widget.
What’s new?
Every viewer of the dashboard sees the delta against the earlier period, a direction arrow, and a colour showing whether the movement is favourable. The compared window is always labelled with resolved dates rather than a relative phrase, so viewers know exactly what is being measured against what.
Note:
- Period Comparison is available on KPI widgets only.
- Period Comparison applies only to numeric values.
Learn more here: Analytics Dashboard Builder.
Colour Selection for Charts
Charts previously used a fixed system palette assigned by series order. This produced off-brand reports, categories that read wrong to the viewer, such as Lost rendering as teal, and the same metric changing colour between artefacts. Report and dashboard authors can now control chart colours.
What’s new?
In both the Report Builder and the Dashboard Builder, you can set one colour per series on Bar, Column, Line, and Area charts, or apply a preset colour scheme on Pie, Donut, and Funnel charts. Viewers get on-brand, semantically correct charts that stay consistent wherever the metric appears.
Learn more here: Analytics Report Builder.
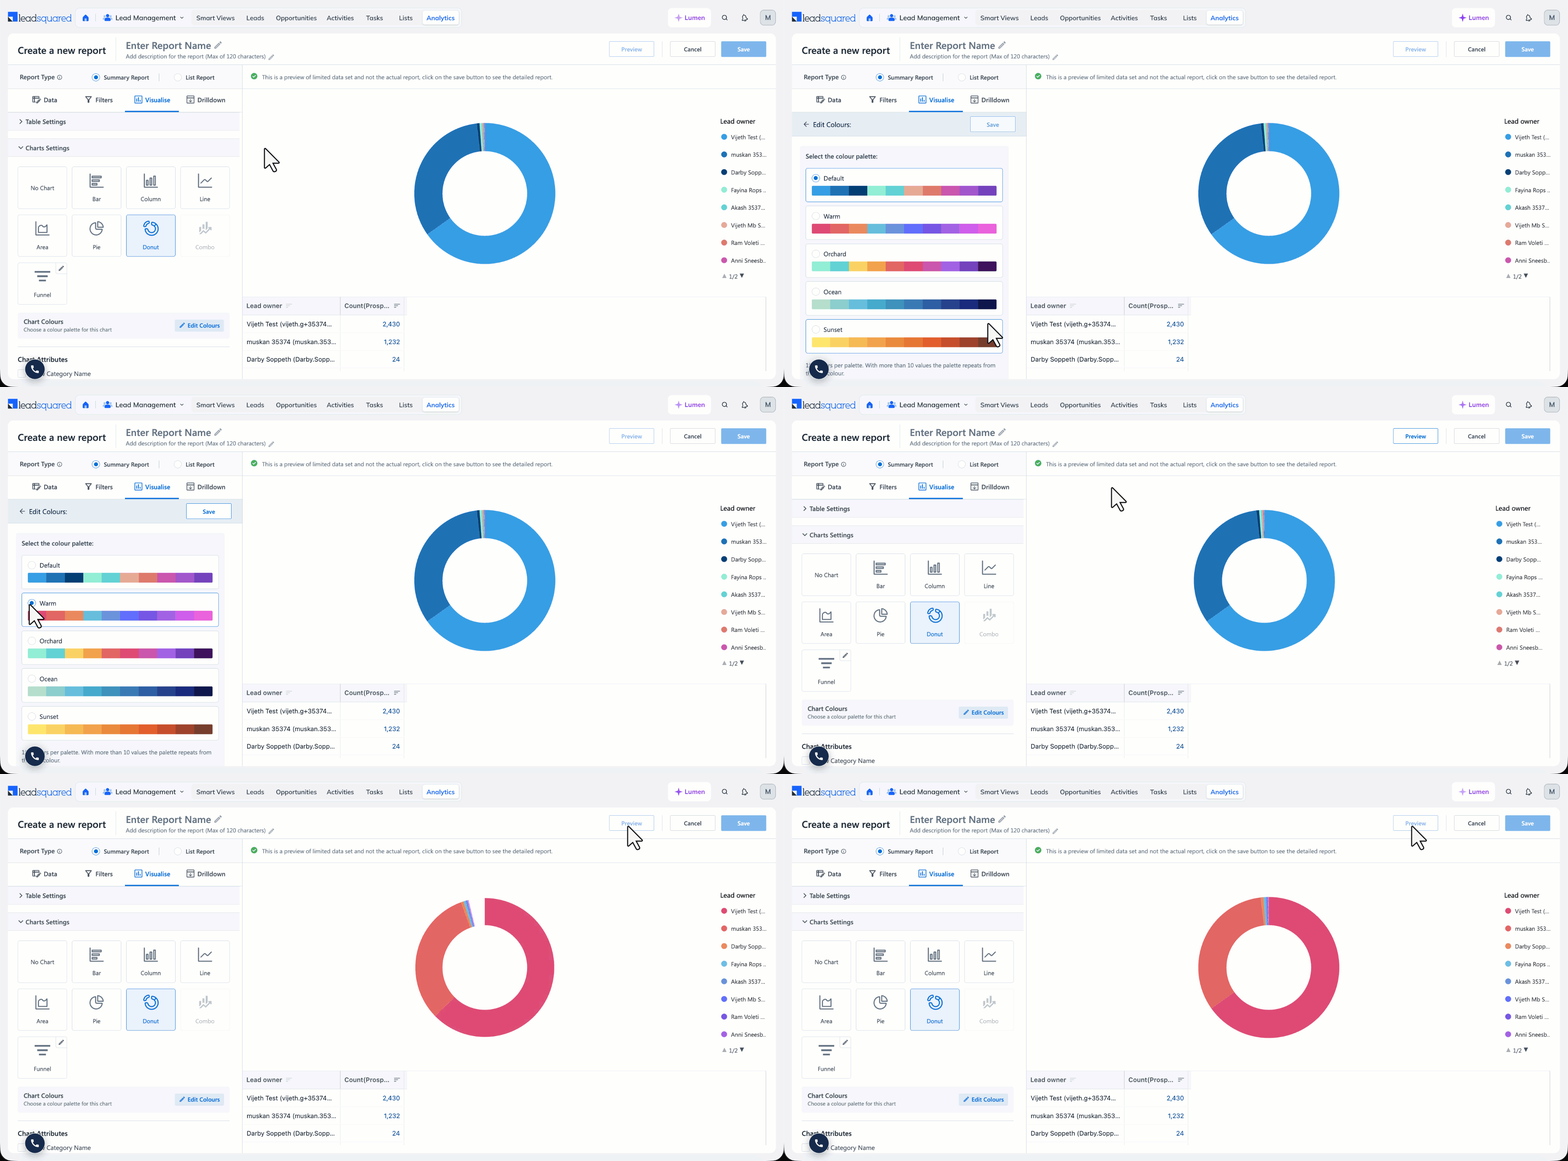
Table Calculations (“Show Value As”)
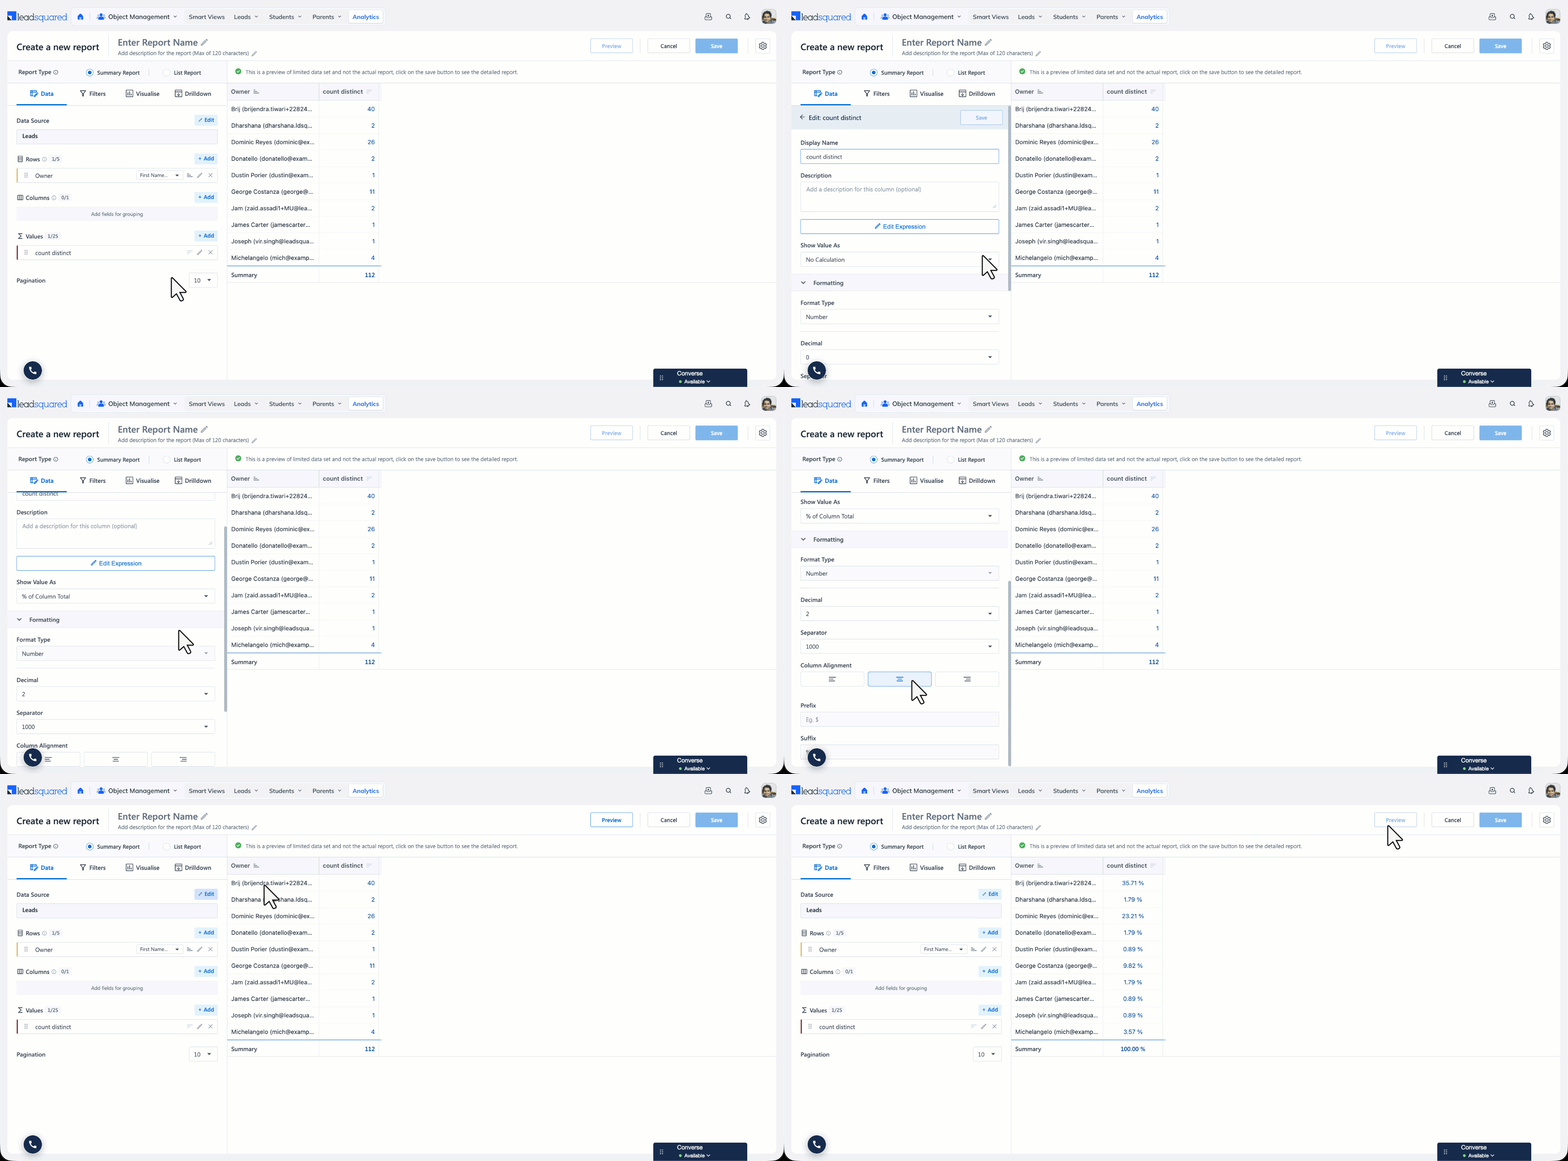
Reading contribution and distribution previously meant exporting a report to Excel to work out what share a row represented. Report creators can now display any measure as a percentage of its column, row, or grand total, or as an Index.
What’s new?
Show Value As is set per measure in the Summary Report builder. Anyone opening that report reads contribution and distribution directly on screen. Percentages respect active filters and drilldown, and carry through exports.
Learn more here: Analytics Expression Builder.
Bug Fixes
Dashboards
- Drill-down now honours the selected date filter – Fixed an issue where drill-down data ignored the date filter applied to the dashboard, so the rows returned did not match the summary count shown on the widget.
- Custom date filters now reflect in dashboards – Fixed an issue where a custom date range selected on a dashboard was not applied to the underlying widgets.
- Filter changes no longer leave stale data on screen – Fixed an issue where a dashboard continued to show the previous filter’s results after the user changed the filter, caused by a race condition between the outgoing and incoming requests.
- Dropdowns reachable at default zoom; Back button no longer closes reports – Fixed an issue where filter and dropdown lists on dashboards and SIERA reports were cut off at 100% browser zoom, and where the browser Back button exited the report instead of returning to the previous view.
- Service Users populate in the Ticket Owner filter – Fixed an issue where the Ticket Owner filter on the Service Dashboard returned an empty list of Service Users.
- Marvin logout no longer hangs – Fixed an issue where logging out left the screen on an infinite loader instead of completing the sign-out.
Reports and Report Builder
- Drill-down name links open the correct lead record – Fixed an issue where every First Name link in the Conversion Report-1 drill-down grid resolved to the same or an unrelated lead record instead of the row that was clicked.
- Names and Lead ID drill-down restored after FLE migration – Fixed an issue where reports showed blank First Name and Last Name columns following the field-level encryption migration, and where the Lead ID hyperlink drill-down stopped working.
- Custom column hyperlinks render as clickable links – Fixed an issue where a hyperlink configured through a custom column was displayed as plain text and could not be clicked.
- LSQ redirection works in Query reports – Fixed an issue where redirection back into LeadSquared failed in one Query report scenario.
- Correct user details fetched in reports – Fixed an issue where a SIERA report returned user details belonging to a different user than the one on the record.
- PJP Compliance Report drill-down shows the Facility value- Fixed an issue where the Facility column in the drill-down intermittently rendered “No Value” where data existed.
- Historical task data returned in Client Visit – Equity Detailed Report – Fixed an issue where records created before March 2026 were missing from the report entirely.
Calculations and Exports
- Index values calculate correctly when data contains No Value – Fixed an issue where Index displayed 0 for rows where the underlying data held a No Value entry, instead of the value the formula produces.
- Prefix and suffix retained in long exports – Fixed an issue where prefix and suffix formatting configured on a column was dropped in both CSV and PDF long exports.
Enhancements
- Applied Column hidden from the Report Builder UI – Applied Column is a tenant-level configuration field. It carried no meaning for report authors and added noise to the configuration view, so it is no longer surfaced in the Report Builder.
