


Get Started

Sales Suite
Field Ops
Marketing
Service CRM
Integrations & Apps
FloStack
SIERA Expression Builder

1. Feature Overview
Analytics Expression Builder tool lets Admins create their own expressions that can be used to easily retrieve and manipulate data on any report. This is an evolving tool and presently helps users write basic aggregate functions with multi-conditions.
2. Prerequisites
- To enable Analytics it for your account, contact your account manager or support@leadsquared.com.
- To learn how to create an Analytics report, refer to this article: Analytics Report Builder.
3. Expression Builder Rules
- A field in the expression builder has to be enclosed with backticks, and written as the data source name followed by the field’s schema name. For example,
`Data_Source_Name.Schema_Name`. - Use the schema name of the field, not its display name. For example, the Lead Stage field is written as
`Leads.ProspectStage`. Schema names are unique across your account, while display names can be repeated, so using schema names prevents ambiguity when two fields share the same name.- To find the schema name of a lead field, navigate to My Profile>Settings>Leads>Lead Fields, and refer to the Schema Name column. To know more, refer to How to find Schema Name of a Lead field?
- The values for a string have to be in single quotes. For example,
'string'. - An array of values must be enclosed in square brackets. For example,
['Value 1', 'Value 2']. - Analytics stores empty date values as 01-01-1925. If you want to write an expression with null date values excluded, use
ToYear(<date field>) > 1925. Similarly,ToYear(<date field>) <= 1925will filter rows with date values not defined. For example,CountDistinctIf(`Leads.ProspectID`, ToYear(`Leads.mx_Date_of_Birth`) > 1925)will return leads who have a defined date of birth.CountDistinctIf(`Leads.ProspectID`, ToYear(`Leads.mx_Date_of_Birth`) <= 1925)will return leads where the date of birth is not defined.
- Clicking on a tab will enter the selected function from the expression builder.
`Leads.Lead Score`. They are now written using the field’s schema name, for example `Leads.Score`.
4. Types of Expressions
Expressions in Analytics are of 3 types –
- Aggregated Expressions – An aggregate expression uses an aggregate function to summarize a selected metric. These include expressions like Count, CountDistinct, Sum, Min, Max, and Avg.
- For example, if we want to get a count of leads, we can use the expression
Count(<field name>).
- For example, if we want to get a count of leads, we can use the expression
- Conditional Expressions – Conditional expressions use aggregate functions along with conditions.
- For example, if you want to Count leads only if they are from Google and Facebook, using an expression of Count() will not work. In this case, we can use
CountIf(<condition>).
- For example, if you want to Count leads only if they are from Google and Facebook, using an expression of Count() will not work. In this case, we can use
- Calculated Values – Calculated Values are a combination of 2 or more expressions (aggregated or conditional) on arithmetic functions like +, –, *, or /.
- For example, if we want the percentage of leads from Google and Facebook over total leads, we can use
(Countif(<condition>)/Count(<field name>))*100. Calculated Values do not support drill-down in the reports or dashboards.
- For example, if we want the percentage of leads from Google and Facebook over total leads, we can use
5. Navigate to Expression Builder
Follow the steps below to navigate to the expression builder:
- Click the + Add Values button under the Values tab.
- Click + Custom Values.
- Create your custom expression and click Save Expression.
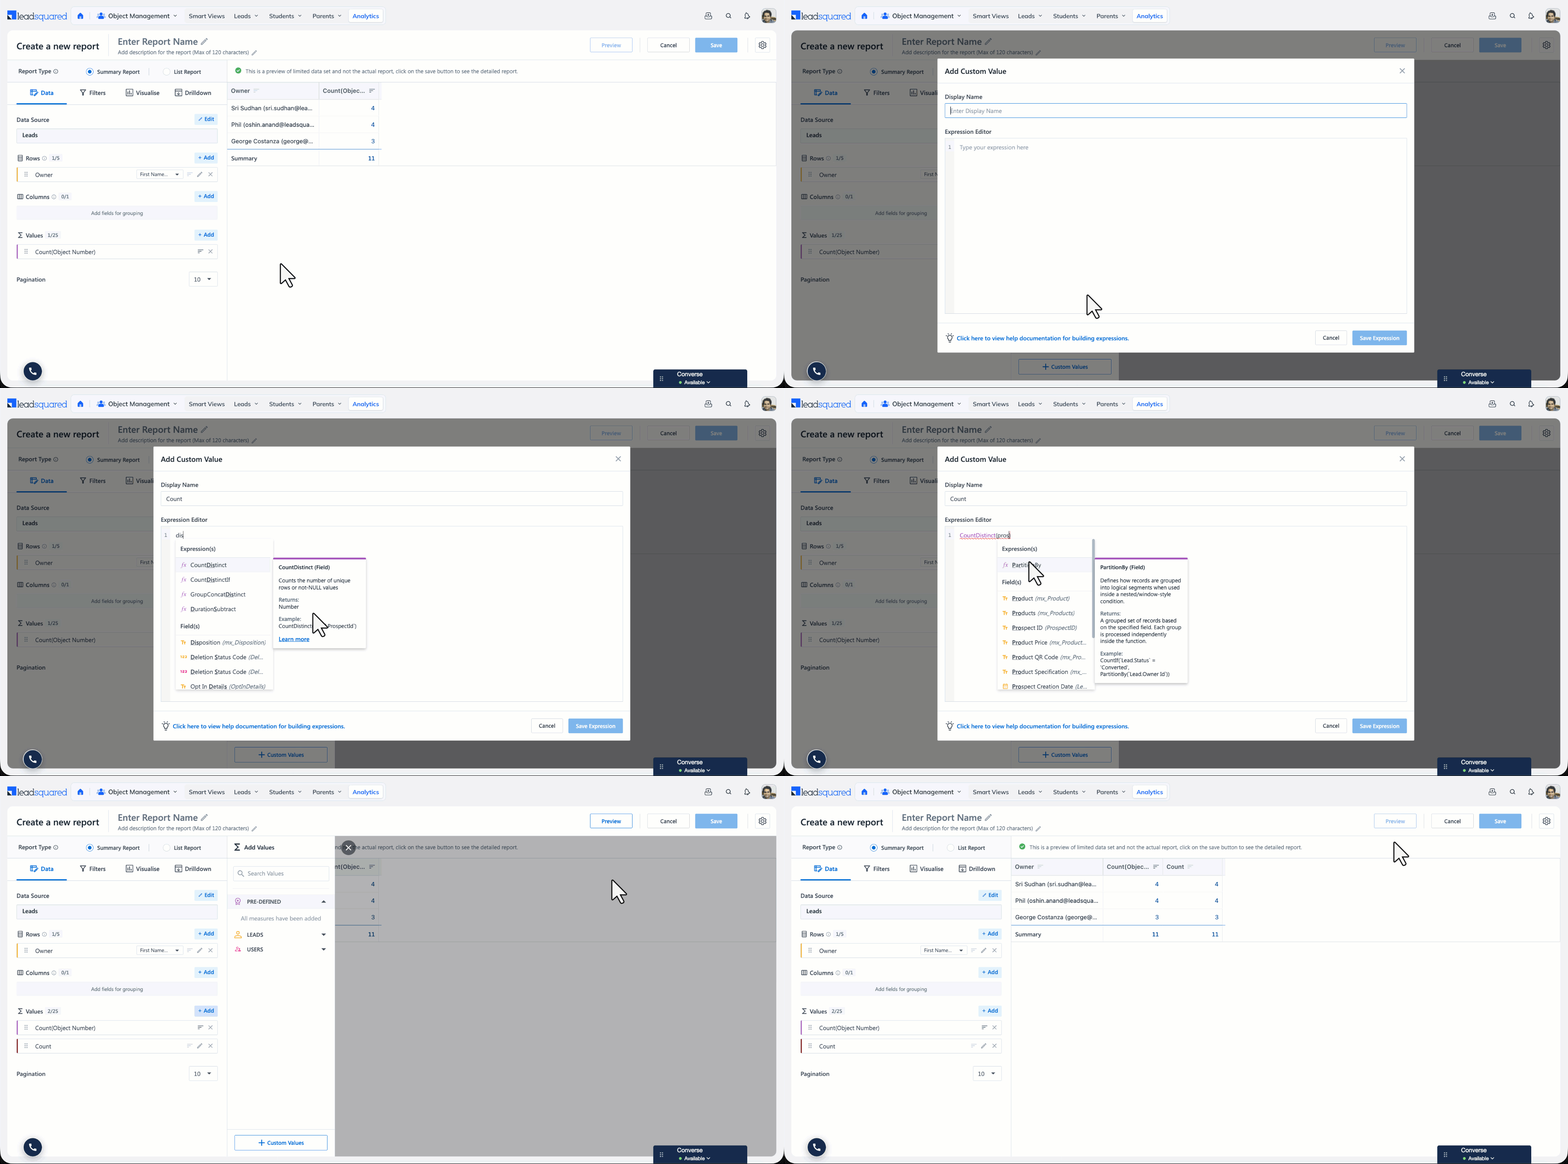
The sections below will help you understand the syntax and usage of various functions available for building expressions.
6. Editing a Value
Once you add a value to a report, you can edit its name, its expression, the calculation applied to it, and how it’s displayed in the report.
6.1 Navigate to the Edit Panel
On the Data tab, under the Values section, Click on the Edit icon over the value you want to edit.
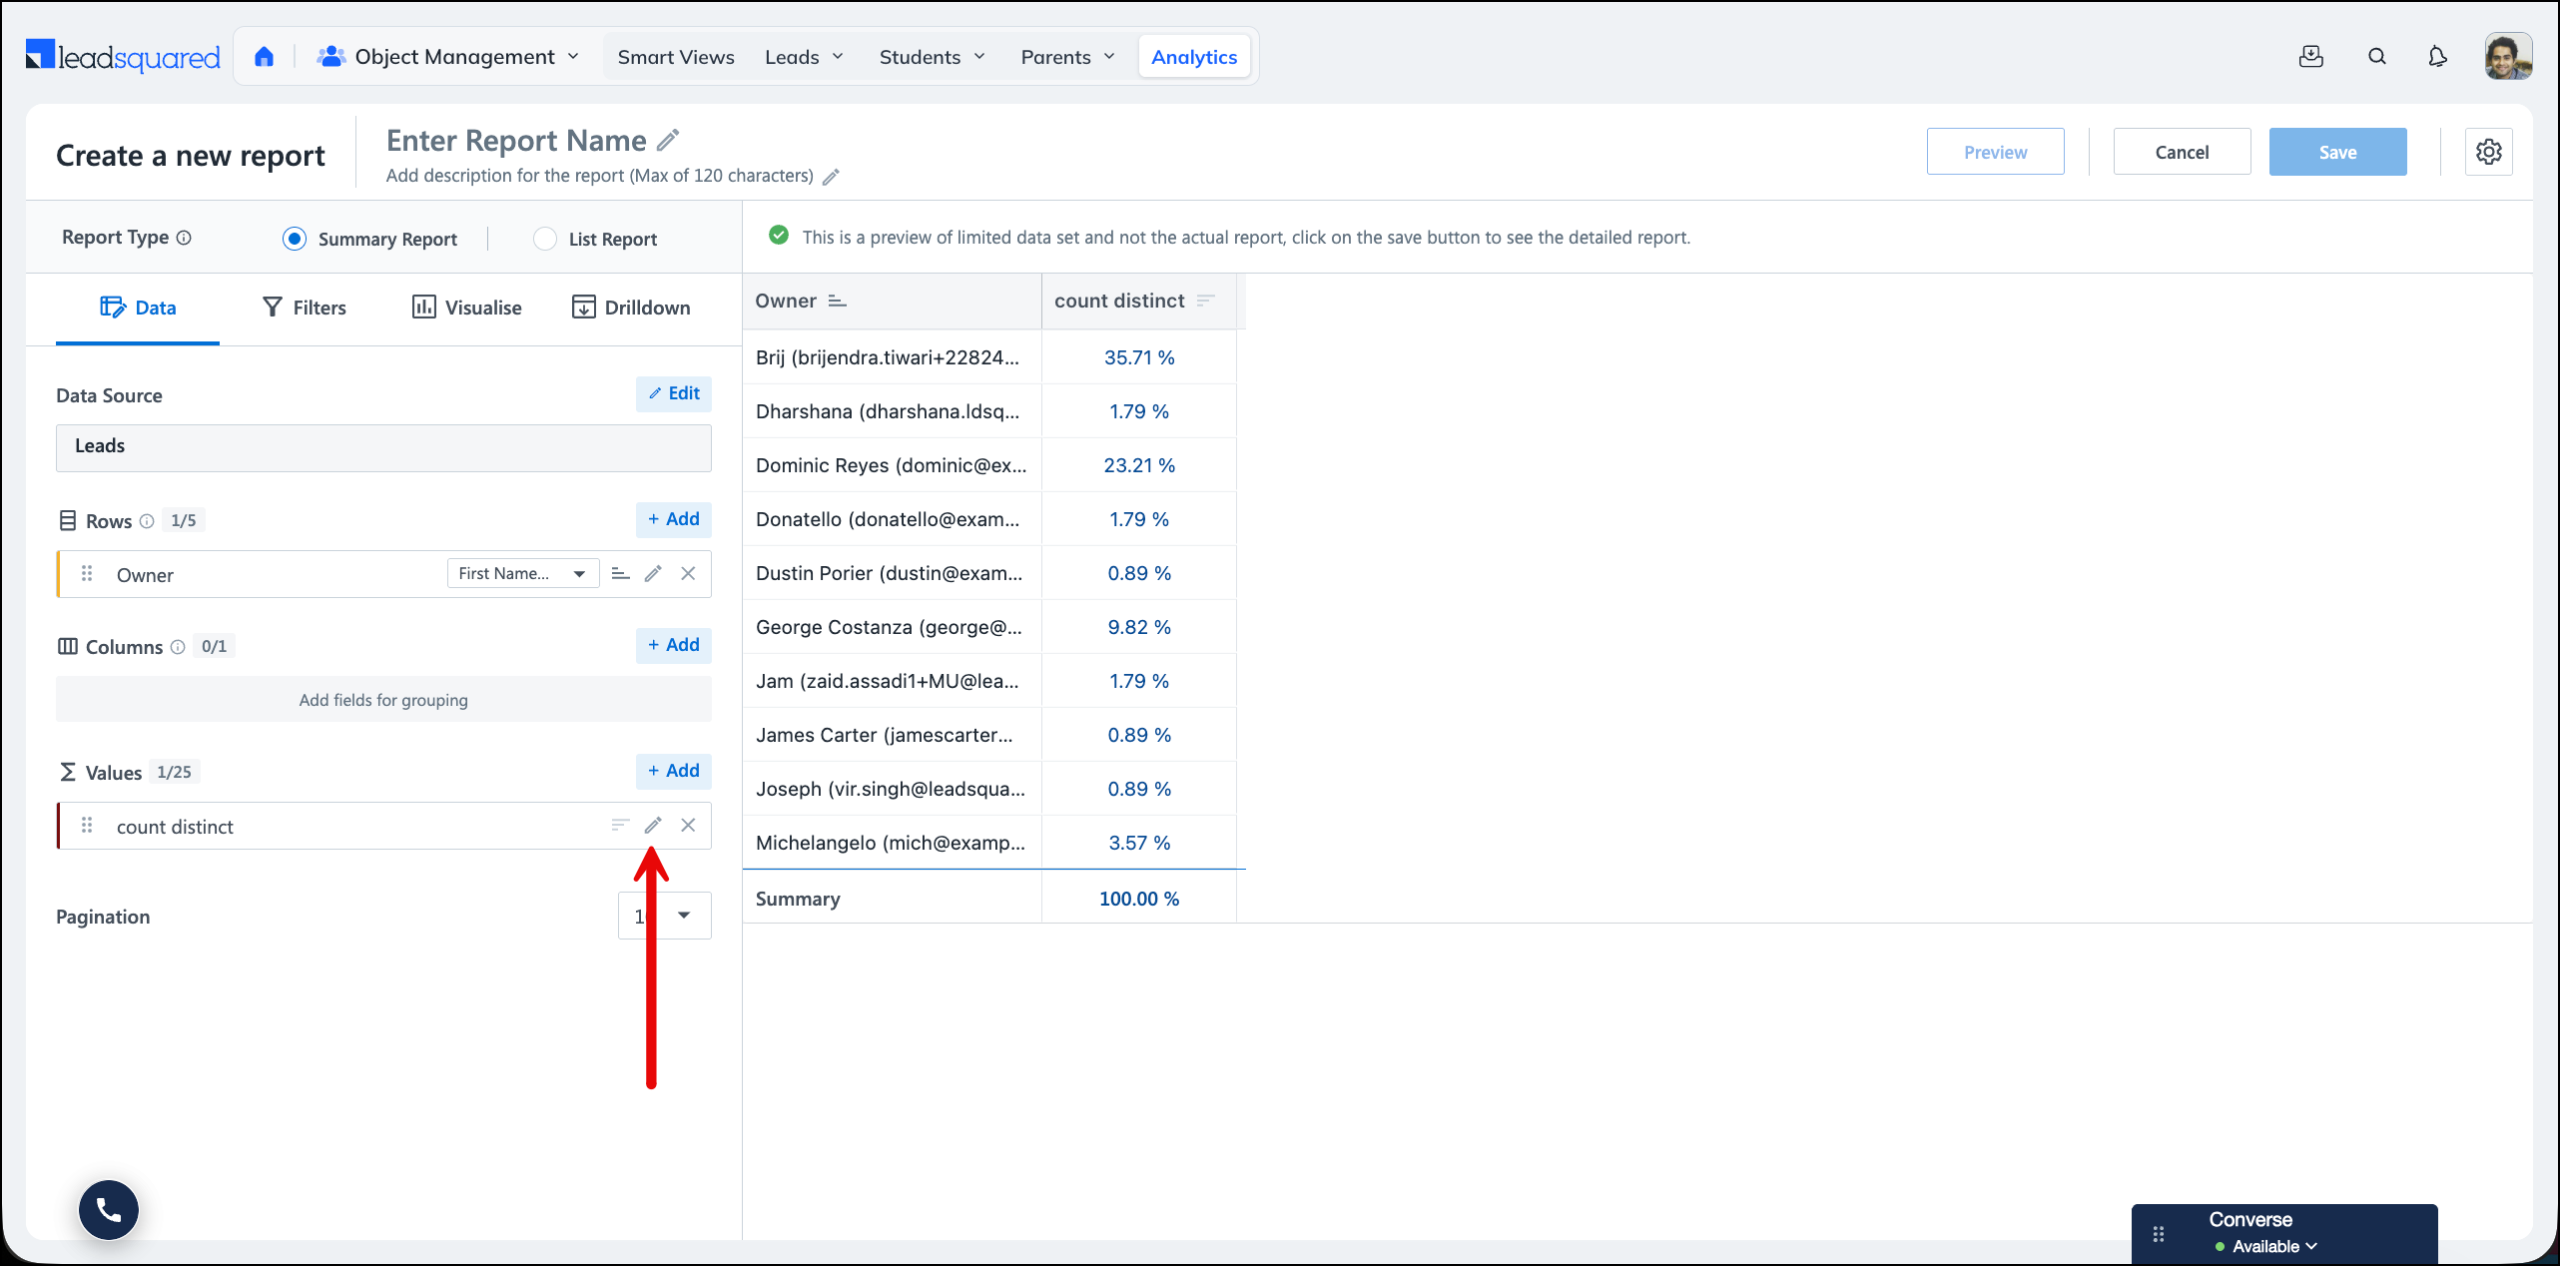
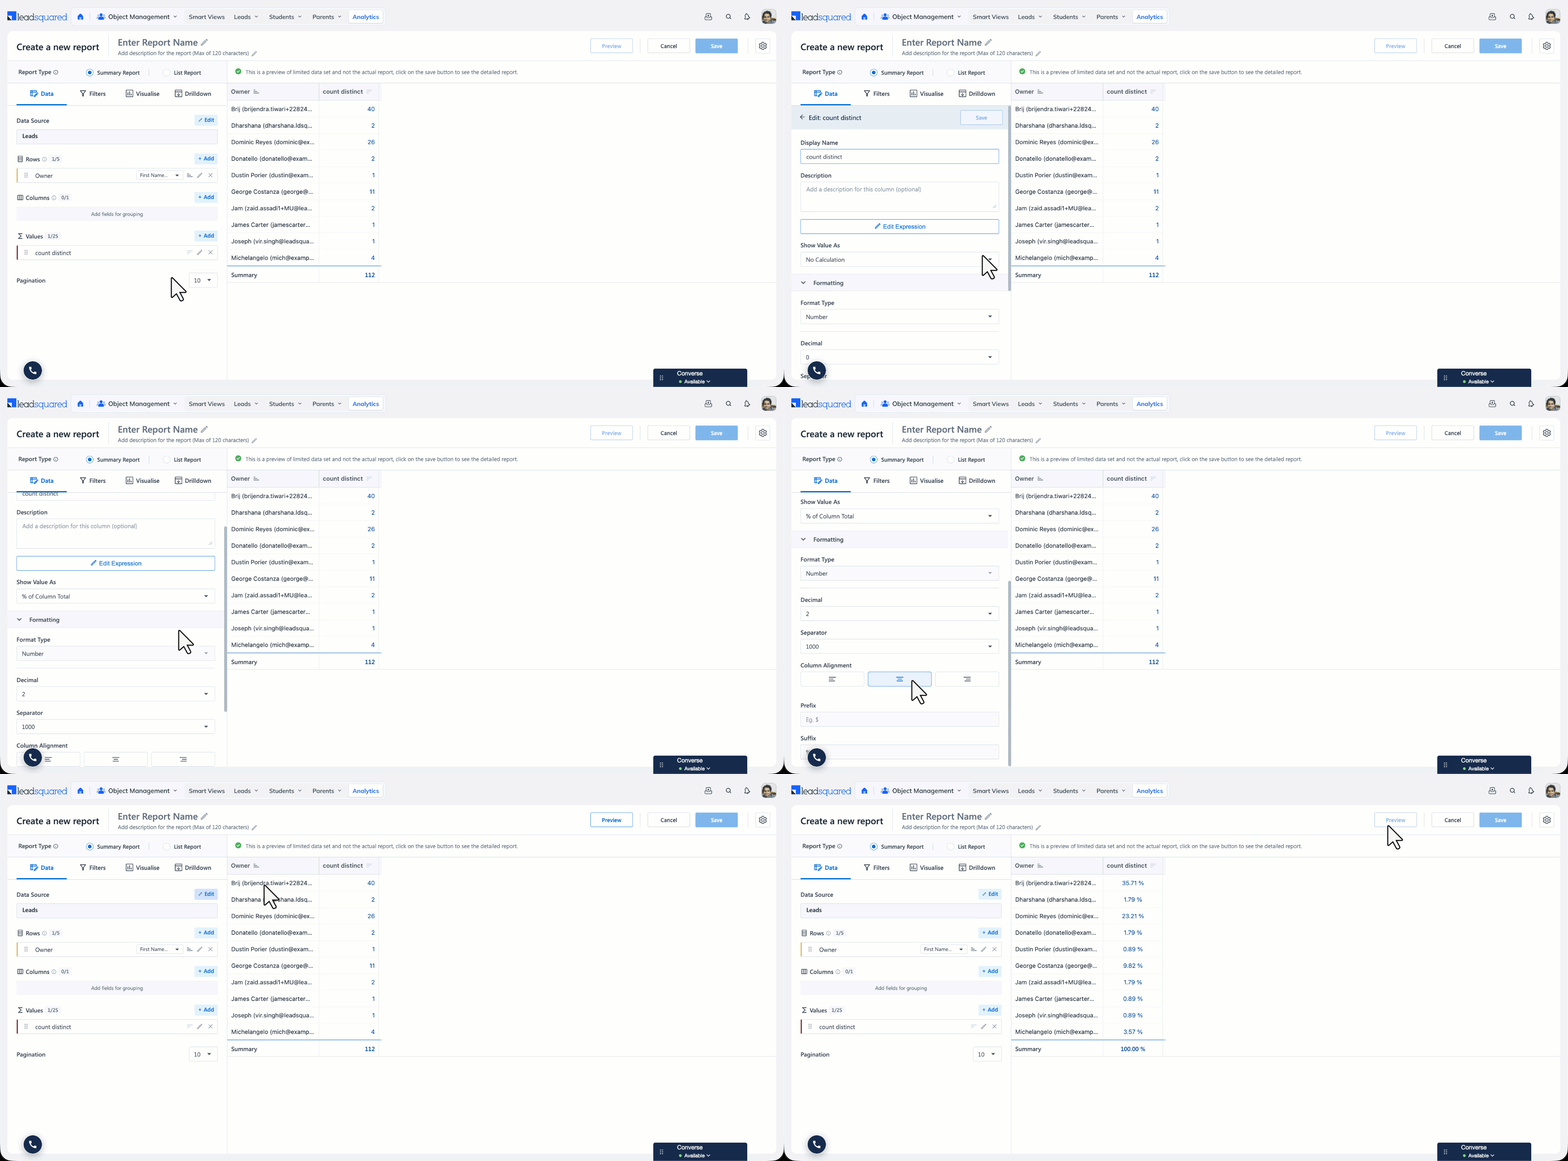
The edit panel contains the following options:
- Display Name – The name of the column as it appears in the report.
- Description – An optional description for the column.
- Edit Expression – Opens the expression builder, where you can change the expression behind the value.
- Show Value As – Applies a calculation to the value. See section 6.2.
- Formatting – Controls how the value is displayed in the report. See section 6.3.
6.2 Show Value As
Show Value As displays your value as a percentage of a total, instead of as the raw number the expression returns. For example, if an owner has 20 leads out of 100, you can display 20% instead of 20.
The options available are listed below.
| Option | Description |
| No Calculation | Displays the value exactly as the expression returns it. This is the default. |
| % of Column Total | Displays each value as a percentage of the total of the column it belongs to. Every column adds up to 100%. For example, if the Count of Leads column totals 100 and an owner accounts for 20 of them, that owner’s row displays 20%. |
| % of Row Total | Displays each value as a percentage of the total of the row it belongs to. Every row adds up to 100%. This is useful when your report has a column grouping that splits each row into segments. |
| % of Grand Total | Displays each value as a percentage of the grand total of the report. The grand total is the number shown in the Summary row. |
| Index | Displays each value as a ratio of the total, where the total is 1 rather than 100%. For example, a value that accounts for 60% of the total displays as 0.6. |
6.3 Formatting
Use the Formatting section to control how the value is displayed in the report.
| Option | Description |
| Format Type | The type of value the column holds. Select Number, Currency, or Duration. |
| Decimal | The number of decimal places to display. Select 0, 1, 2, or 3. |
| Separator | How the digits in the value are grouped. Select 1000 or 100, or select None to display the value without separators. |
| Column Alignment | Aligns the values in the column to the left, centre, or right. |
| Prefix | Text to display before the value, for example $. |
| Suffix | Text to display after the value, for example %. |
7. Operators, Conditions, and Constants
| Function & Example Expression |
| Equal – Used to compare if 2 values or fields are equal.
|
| Not Equal – Used to compare if 2 values or fields are not equal.
|
| Less Than – Used to compare if a value or field is less than compared to another value or field.
|
| Less Than or Equal – Used to compare if a value or field is less than or equal to another value or field.
|
| Greater Than – Used to compare if a value or field is greater than compared to another value or field.
|
| Greater Than or Equal –Used to compare if a value or field is greater than or equal to another value or field.
|
| in – Used to determine whether the value exists in a list of values.
|
| notin – Used to determine whether the value does not exist in a list of values.
|
| Text Constant – Text constant to be written as ‘Text’, with quotations.
|
| Number Constant – Number constant to be written as 50, without quotations.
|
| Addition – Used to add two values in your report. Fields (Number type) and constants can be used as operands
|
| Subtraction – Used to subtract two values in your report. Fields (Number type) and constants can be used as operands.
|
| Multiplication – Used to multiply two values in your report. Fields (Number type) and constants can be used as operands.
|
| Division – Used to divide two values in your report. Fields (Number type) and constants can be used as operands.
|
| Like – Matches string against SQL LIKE pattern (case-sensitive).
|
| ILike – Matches string against SQL LIKE pattern (case-insensitive).
|
8. Logical Expressions
| Function & Example Expression |
| and – An and expression returns true if all of its operands are true. The and expression will work if there is more than 1 expression inside it.
For example, let’s say you want to return TRUE when a Lead has converted (Stage is Customer) and if the Source is either from Referral or Affiliate.
|
| or – An or expression returns true if any of its operands are true. The or expression will work if there is more than 1 expression inside it.
For example, let’s say you want to return TRUE when a Lead has converted (Stage is Customer) or if the Sub-stage is either Converted or Paid.
|
9. Aggregate Expressions
Note:
- Expression fields should be included in row grouping. OwnerIdAutoId should be preferred for partitioning.
- Some of the expressions below support Partition. It divides a value or dataset into separate segments so each segment can be processed independently. This is useful when you want calculations or logic to run within specific groups rather than across the entire dataset.
| Function & Example Expression |
| SUM
The Sum function allows you to calculate the sum of numeric values within a given field. Example 1 – Create the calculated column which stores the sum of the field mx_Custom_2. We can use the Expression Builder to write the expression.
Example 2 – Calculates a running or total sum of Lead Score counts within each Owner’s partition.
|
| SumIf
The SumIf function allows you to calculate the sum of numeric values within a given field along with some conditions. Example 1 – Create the calculated column which stores the sum of the field mx_Custom_2 when Stage is “Customer”. We can use the Expression Builder to write the expression as given.
Example 2 – Sums the count of Lead Score values only for rows where Lead Score is greater than 0, grouped by Owner.
|
| Count
The Count function lets you count the number of occurrences of a specific value or field within a given range. Example 1 – Create the calculated column which stores the count of the leads.
Example 2 – Counts the number of rows in each Team partition after computing the summed Lead Score for each row.
|
| CountIf
The CountIf function allows you to count the number of occurrences that meet a specific condition. Example 1 – Create a calculated column that stores the count of the leads when the lead stage is ‘Prospect’.
Example 2 – Counts how many leads have a Lead Stage of Converted within each Owner partition.
|
| CountDistinct
The CountDistinct function allows you to count the unique number of occurrences that meet a specific condition. Example 1 – Create a calculated column that stores the count of unique leads.
Example 2 – Calculates the percentage contribution of distinct Prospect IDs relative to the overall total across all partitions (Used in a % Grand Total scenario).
% Grand Total Usecase |
| CountDistinctIf
The CountDistinctIf function allows you to count the distinct number of occurrences that meet a specific condition. Example 1 – Create a calculated column that stores the count of distinct leads when the lead stage is ‘Prospect’.
Example 2 – Counts distinct Prospect IDs where the Lead Stage is Converted, grouped by Owner.
|
| Max
The Max function allows you to calculate the maximum of numeric values within a given field. Example 1 – Create the calculated column which stores the maximum of the field mx_Custom_2.
Example 2 – Returns the maximum summed Lead Score within each Owner’s partition.
|
| Min
The Min function allows you to calculate the minimum of numeric values within a given field. Example 1 – Create the calculated column which stores the minimum of the field mx_Custom_2.
Example 2 – Returns the minimum summed Lead Score within each Owner’s partition.
|
| Avg
The Avg function allows you to calculate the average of numeric values within a given field. Example 1 – create the calculated column which stores the average of the field mx_Custom_2.
Example 2 – Returns the average summed Lead Score within each Owner’s partition.
|
| MaxIf
The MaxIf function allows you to calculate the maximum of numeric values within a given field along with some conditions. Example 1 – Create the calculated column which stores the maximum of the field mx_Custom_2 when Stage is ‘Prospect’.
Example 2 – Returns the maximum summed Lead Score but only for rows where Lead Score is greater than 0, grouped by Owner.
|
| MinIf
The MinIf function allows you to calculate the minimum of numeric values within a given field along with some conditions. Example 1 – Create the calculated column which stores the minimum of the field mx_Custom_2 when Stage is ‘Prospect’.
Example 2 – Returns the minimum count of Lead Score only for rows where Lead Score is greater than 0, grouped by Owner.
|
| AvgIf
The AVGIF function allows you to calculate the average of numeric values within a given field along with some conditions. Example 1 – Create the calculated column which stores the average of the field mx_Custom_2 when Stage is ‘Prospect’.
Example 2 – Returns the average count of Lead Score only for rows where Lead Score is greater than 0, grouped by Owner.
|
| ArgMax
Returns the value of target_field for which selector_field is maximum. For example, the expression below returns the Lead Source of the lead that has the most recent Updated On date.
|
| ArgMin
Returns the value of target_field for which selector_field is minimum. For example, the expression below returns the Lead Source of the lead that has the earliest Updated On date.
|
| ArgMaxIf
Returns the value of target_field for which selector_field is maximum where condition holds. For example, the expression below returns the Lead Source of the most recently updated lead, but only among leads whose Lead Stage is Converted.
|
| ArgMinIf
Returns the value of target_field for which selector_field is minimum where condition holds. For example, the expression below returns the Lead Source of the earliest created lead, but only among leads whose Lead Stage is New.
|
| Any
Returns any arbitrary value of the field from a group. For example, the expression below returns any one City value from the group.
|
| AnyHeavy
Returns the most frequent value (>50%) using heavy-hitters algorithm. For example, the expression below returns the most frequently occurring City, but only if it appears in more than 50% of the records.
|
| AnyLast
Returns the last-seen value based on processing order. For example, the expression below returns the last-seen Lead Stage value based on the order in which records were processed.
|
10. Date Time Expressions
| Function & Example Expressions |
| DurationAdd
The DurationAdd function allows you to add any duration to a particular date field. Allowed Units – second, minute, hour, day, week, month, quarter, year Returns – Added Duration (DateTime) For example, you can create the calculated expression which counts the lead which came into the system 4 months ago and the current stage is not ‘Customer’.
|
| DurationSubtract
The DurationSubtract function allows you to subtract any duration from a particular date field. Allowed Units – second, minute, hour, day, week, month, quarter, year Returned Value – Subtracted Duration (DateTime) For example, you can create the calculated expression which counts the lead which came into the system 4 months ago and the current stage is not ‘Customer’.
|
| CurrentDateTime
The CurrentDateTime function returns the current date and time. For example, you can create a calculated column that stores the date and time 4 months before the current date and time.
|
| ToHour
The ToHour function allows you to extract the hour component of any datetime(timestamp) field. Returned Value: Hour Component (Number) eg: 23 For example, you can write a condition where you want to count the leads which came into the system at 11 PM.
|
| ToYear
The ToYear function allows you to extract the year component of any datetime(timestamp) field. Returned Value: Year Component (Number) eg: 2023 For example, you can write a condition where you want to check if the year component of the datetime field is equal to 2023.
|
| ToYearWeek
The ToYearWeek function allows you to extract the week and year components of any datetime(timestamp) field. Returned Value: Week and Year Component (1-53 Number) Eg: 202345 (45th Week of 2023) For example, you can write a condition where you want to check if the week and year component of the datetime field is equal to the 45th Week of 2023.
|
| ToMonthOfYear
The ToMonthOfYear function allows you to extract the month component of any datetime(timestamp) field. Returned Value: Month of the Year (1-12 Number) eg: 1 (for January) For example, you can write a condition where you want to check if the month component of the datetime field is equal to January.
|
| ToDateOfYear
The ToDateOfYear function allows you to extract the date component of any datetime(timestamp) field. Returned Value: Date of the Year (1-366 Number) eg: 33 For example, you can write a condition where you want to check if the date component of the datetime field is equal to 2nd Feb.
|
| ToQuarterOfYear
The ToQuarterOfYear function allows you to extract the quarter component of any datetime(timestamp) field. Returned Value: Quarter of the Year (1-4 Number) eg: 2 For example, you can write a condition where you want to check if the quarter component of the datetime field is equal to 2nd Quarter.
|
| ToMonth
The ToMonth function allows you to extract the month and year components of any datetime(timestamp) field. Returned Value: yyyy-mm-01 (String) eg: ‘2023-02-01’ For example, you can write a condition where you want to count the leads created in the month of February 2023.
|
| ToQuarter
The ToQuarter function allows you to extract the quarter and year components of any datetime(timestamp) field. Returned Value: YYYY QX (String) eg: ‘2023 Q2’ For example, you can write a condition where you want to count the leads created in the 2nd Quarter of 2023.
|
| ToDayOfWeek
The ToDayOfWeek function allows you to extract the day of the week component of any datetime(timestamp) field. Returned Value: 1-7 (Number) Range: (1-7: Monday = 1, Tuesday = 2, …, Sunday = 7) eg: ‘6’ for Saturday For example, you can write a condition where you want to count the leads created on Saturdays.
|
| ToWeek
The ToWeek function allows you to extract the week and year components of any datetime(timestamp) field. Returned Value: YYYYWW (Number) eg: 202347 For example, you can write a condition where you want to count the leads created on the 47th Week of 2023.
|
| DateUnitDiff
Returns the count of the specified time unit boundaries crossed between the start and end dates. This can be used to create TAT between 2 date fields. Returned Value: (Number) eg: 43
Accepted Intervals –
The above expression will calculate the TAT for each grouping on average. For cases when there is no value in the date field, the expression builder will take the value of 01-01-1925. To exclude cases where there is no payment done, use the syntax below-
|
| ToDate
Returns the date component from a datetime field. Returned Value: (String) eg: 2023-10-03 For example, you can write a condition where you want to count the leads created on 2023-10-03
|
| ToDayOfTheMonth
Extracts day of month (1–31). For example, the expression below returns the day of the month (1–31) from the Created On date of the lead.
|
| ToDayOfYear
Extracts day number in year (1–366). For example, the expression below returns the day number in the year (1–366) extracted from the Audit Event Time field.
|
11. String and Column Functions
| Function & Example Expression |
| Position
Returns 1-based index of substring; 0 if not found. For example, the expression below checks whether the substring “Pro” exists in the Lead Stage field. If found (i.e., position > 0), it returns “This is Prospect”; otherwise, it returns “This is not Prospect”.
|
| Concat
Concatenates multiple fields into a single string. For example, the expression below combines the First Name and Last Name fields into a single full name string, inserting a space between them.
|
| JSONExtractString
Extracts string value from a JSON object by key. For example, the expression below extracts the “city” value from the JSON object stored in the Additional Info field.
|
| RegexpExtract
Extracts regex capture group by index. For example, the expression below extracts the portion of the email before the ‘@’ symbol using a regular expression, and returns the first captured group (e.g., the username part of the email).
|
12. Window Functions
| Function & Example Expression |
| Lag
Returns value from a previous row in partition. For example, the following expression returns the Lead Stage from the previous row within each Owner’s partition, based on the stage’s ascending order.
|
| Lead
Returns value from a following row in partition. For example, the following expression returns the Created On date from the next row within each Owner’s partition, ordered by creation date in ascending order.
|
| RowNumber
Assigns sequential row number within partition. For example, the following expression assigns a sequential row number to each record within the Owner partition, ordered by Lead Stage.
|
| FirstValue
Returns first value in ordered partition. For example, the following expression returns the first Lead Stage value in each Owner’s partition, based on ascending stage order.
|
| LastValue
Returns last value in ordered partition. For example, the following expression returns the last Lead Stage value in each Owner’s partition, based on ascending stage order.
|
13. Custom Dimensions
| Function & Example Expressions |
| If
Returns a string based on a condition. The condition can be nested. Returned Value: (String) e.g., ‘Hot’, ‘Medium’, ‘Cold’ For example, let’s assume we want to classify leads based on their ProspectStage into ‘Hot’, ‘Medium’, or ‘Cold’ categories.
|
Any Questions?
If you have any questions related to Expression Builder that weren’t answered here, please leave comments below. We’ll be happy to help!
Hi
I try to create a custom column using the expression
If(
All Activities.ActivityEvent= 217,All Activities.ActivityDate,Null) and when i replace the Null with 0 it allow me to save but when i try to use this column in report it show “Incompatible data formats detected!Some fields from the data source use different data representations and cannot be processed together. Please review and add compatible fields in the Data Source section.”
as
All Activities.ActivityDatethis is Date range and i try to remove the the missing value with 0 that’s why it give me error i also try to use this formula “MinIf(All Activities.ActivityDate,All Activities.ActivityEvent= 217)” bu i can’t save this one i don’t why can you please help me in this.Hi, we’ll need a bit more information about the use case you’re trying to address. Could you please raise a support ticket at support@leadsquared.com with the relevant details so our team can assist you further?
I want to make a task report in which all tasks should show which are pending for the day. i am using above CountIf(
ToDate(
EndDate) >= ToDate(CurrentDateTime)AND ToDate(
EndDate) < DurationAdd(ToDate(CurrentDateTime),1,’DAY’)AND
StatusCode= 0)
but not working
Hi. Could you please try with the following expression? The one below encloses the
StatusCodevalue in quotations –CountIf(ToDate(EndDate) >= ToDate(CurrentDateTime)
AND ToDate(EndDate) < DurationAdd(ToDate(CurrentDateTime),1,'DAY') AND StatusCode = '0' )
Hi Team,
I am trying to build a report in SIERA (using the “All Activities” data source) and want to use a custom field for activities in the custom value expression. Specifically:
mx_Custom_1, display name “Reason”).Could you please confirm:
mx_Custom_1) in report expressions by default?Thanks for your help.
Hi. Yes, you can use custom activity fields, but you’ll need to email support@leadsquared.com to get this feature enabled. Please include the use case you’re trying to build, so the support team can assist you further.
I’m not able to create custom expression for Rows. Custom expression is not showing.
Hi. Custom expressions can only be applied to columns, not directly to row groupings.
To use an expression for rows, you first need to create a custom column (from the Data section). Once the custom column is created, you can then select it in your Row grouping or use it in your aggregations.
To learn more about custom columns, refer to Create Custom Columns in SIERA.
I need Help, I am creating a report, In rows, I have partner names, in values, I have Number of leads from respective partners are coming. Now, I need one more column, I which I want to show % of leads from respective partners. How can I get sum of all the leads from all the partners.
1st column I am getting correctly, but for second one, I don’t know How to get the total opportunity value from summary.
Hi. At present, this feature isn’t supported on SIERA, but should be available in a future release.
Hey, is there a ‘like’ function in SIERRA? Like how it works in SQL
Eg: first_name like ‘%raj%’ so it will pull all first_names that have raj
Hi. At present, this functionality isn’t available. But I’ve passed this on to the product team as a feature request.
Hi, I’m trying to figure out how if statements work in SIERRA?
Basically I have two columns connected disposition and not connected disposition and I want to combine both so I want to write an IF statement – if connected is null then not connected else connected – basically an ifnull. But it does not seem to work.
Ref: If(
Activity.mx_Custom_1= Null,Activity.mx_Custom_2,Activity.mx_Custom_1)Hi Ishan. You might need to replace
Nullin the expression with an empty string (''). Could you try the expression below and let me know if it works?If(Activity.mx_Custom_1 = '', Activity.mx_Custom_2, Activity.mx_Custom_1)If I want to count on basis of data contains specific character, then how to use it SIERA.
For Example: Column1 has following data
A123
12C4
H543
8890
GHS0
9430
I want to count if data contains “4″ then output will be 3 (i.e. 12C4, H543, 9430)
How to do this in SIERA
Hi, Ajay. At present, you can’t execute such a query. But I’ve communicated this as a feature request to the team.
Is there any function like starts with specific character
For Example: Column1 has following data
A123
12C4
H543
8890
A783
GHS0
9430
I want count of output where data startswith “A” i.e. A123, A783.
Hi, Ajay. As mentioned before, this functionality isn’t available yet.
Is there any alternative of this functions so we can use it to create Dashboards
There aren’t any alternatives available at the moment.