1. Feature Overview
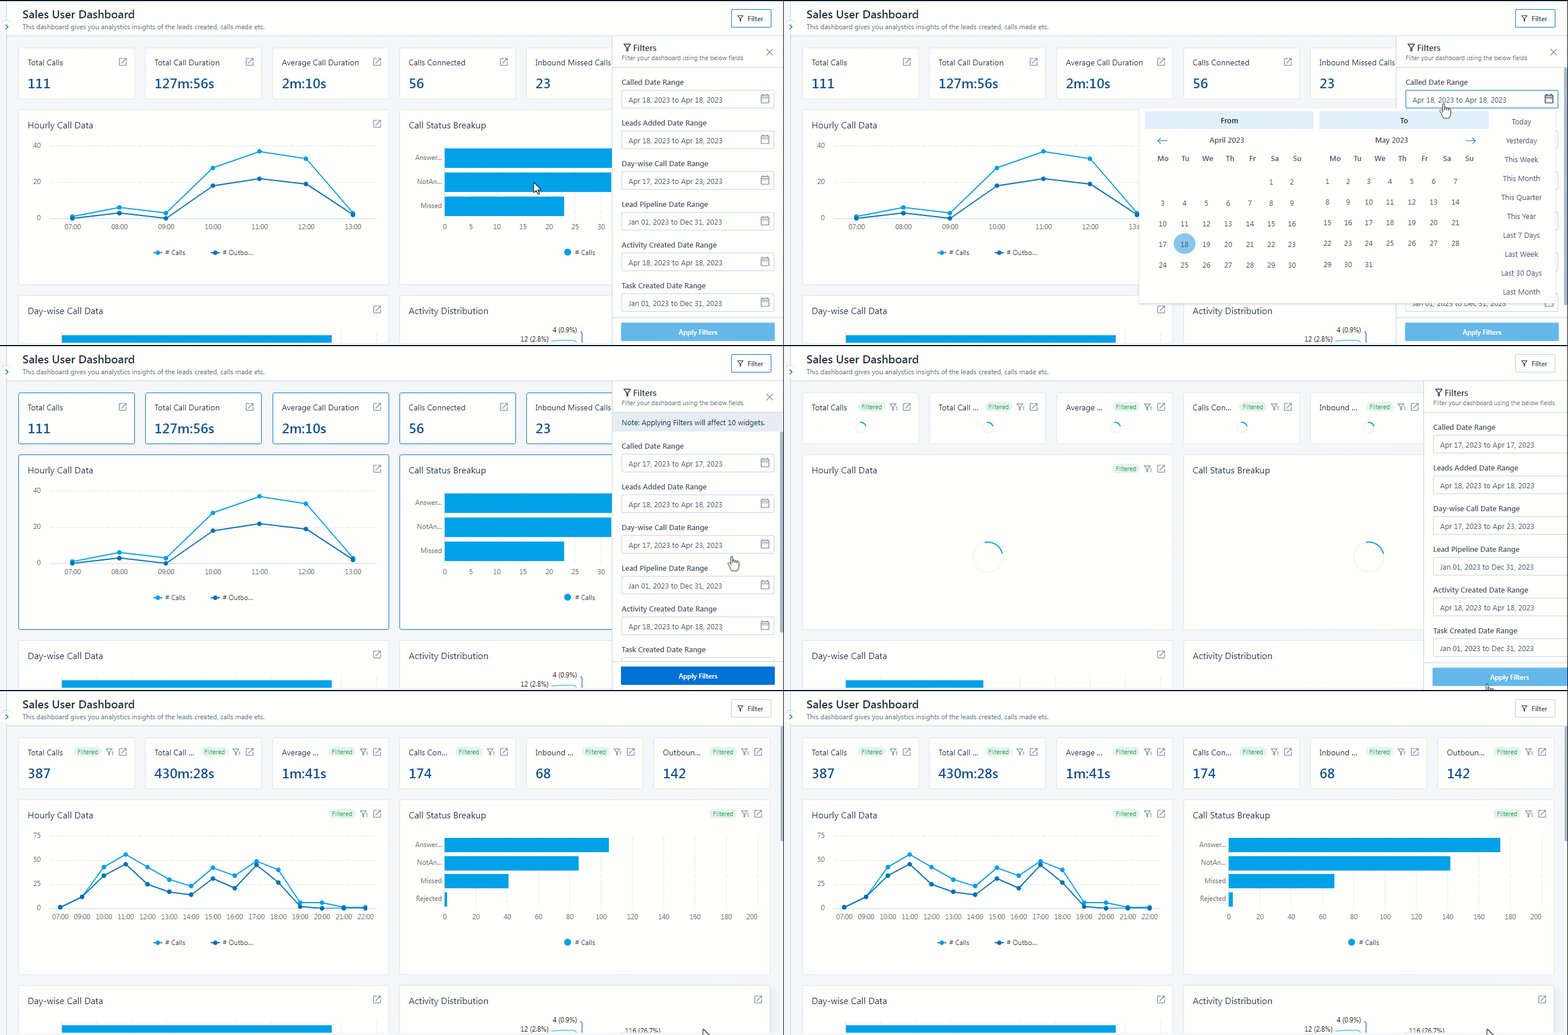
SIERA’s Sales User Dashboard gives you analytics and insights into your entire sales pipeline. The dashboard will give you a birds-eye view of your Call Metrics, Activity Metrics, Lead Metrics, and Task Metrics. You can filter each of these metrics to a specific date range and click on different widgets on the report for further data.
2. Prerequisites
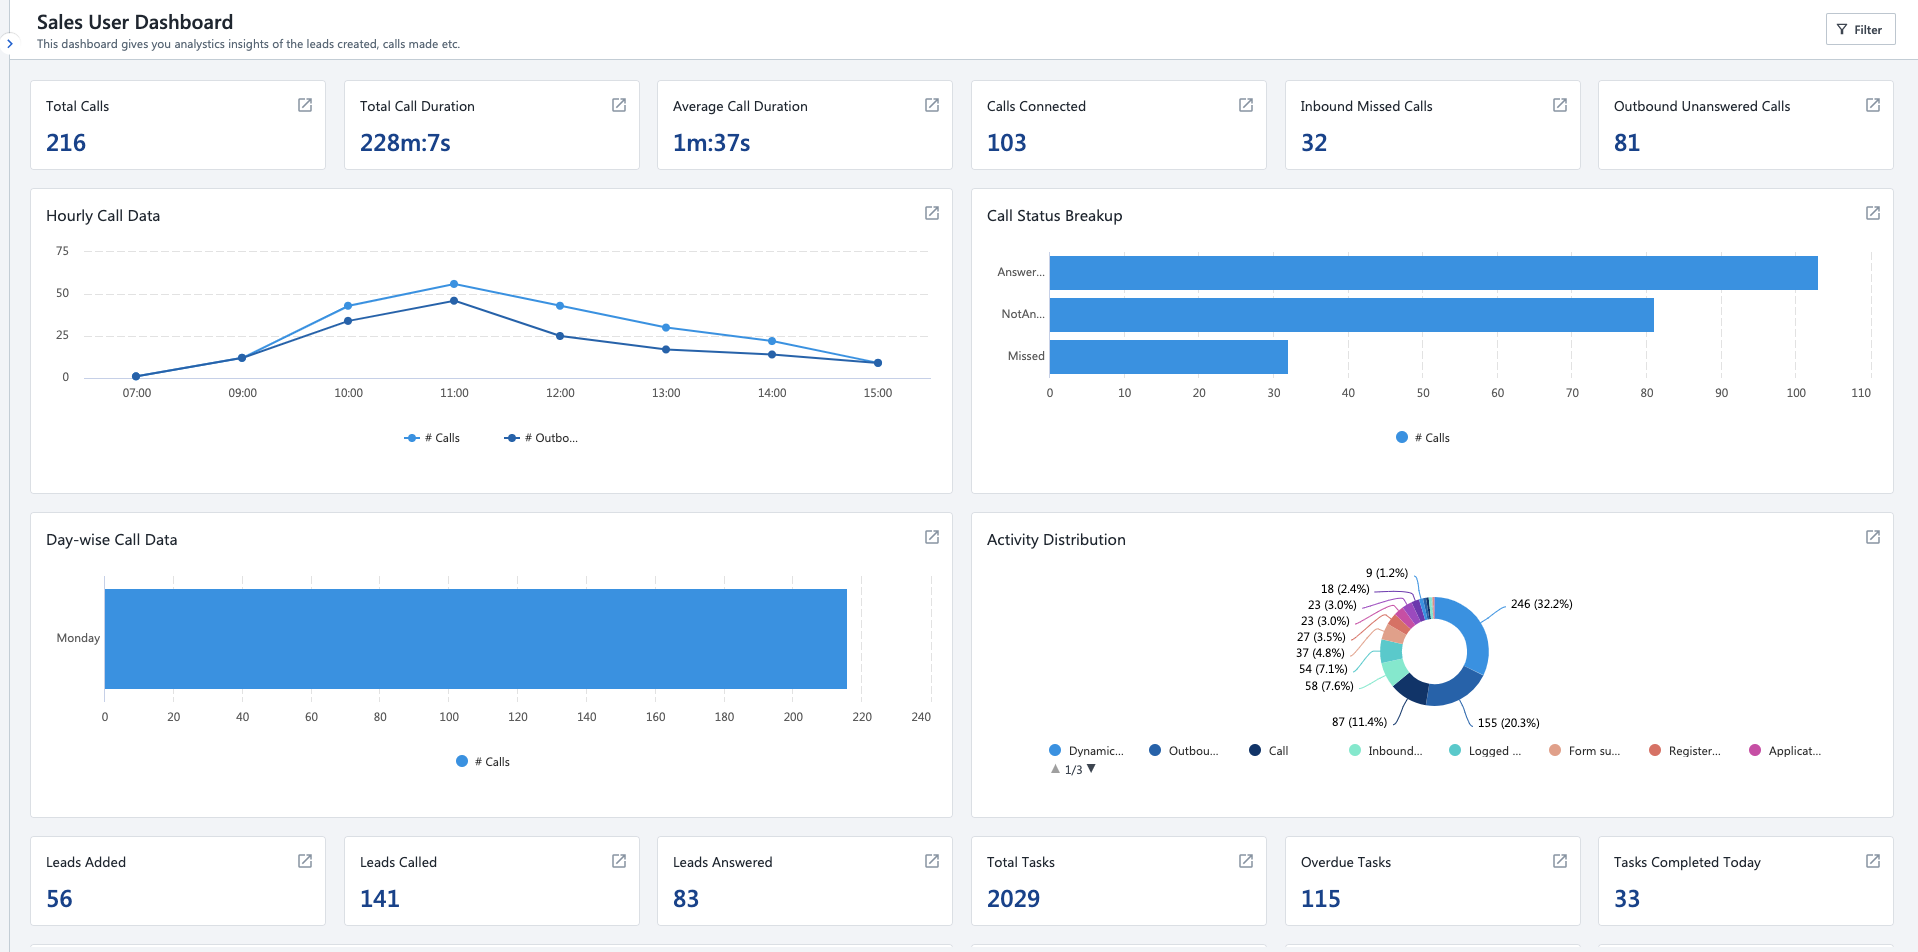
SIERA is a paid feature. To enable it for your account, contact your account manager or siera.support@leadsquared.com.
3. Sales User Dashboard
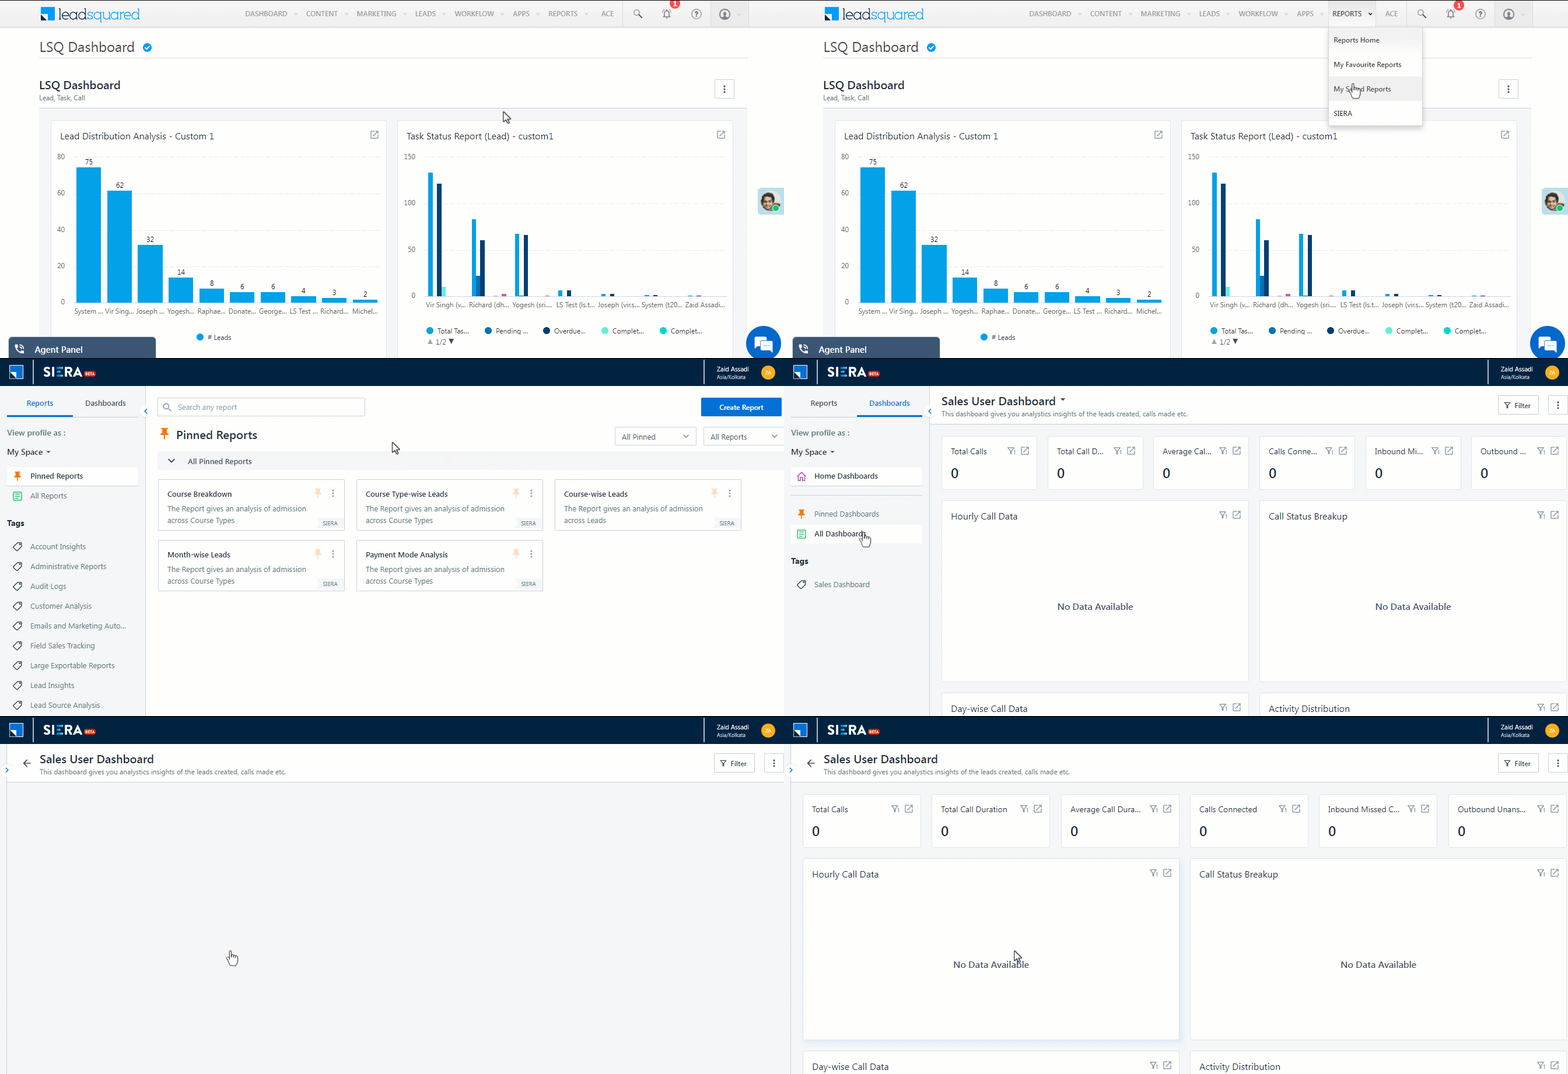
Navigate to Reports>SIERA>Dashboards>All Dashboards and click Sales User Dashboard.
4. Filter Your Sales User Dashboard
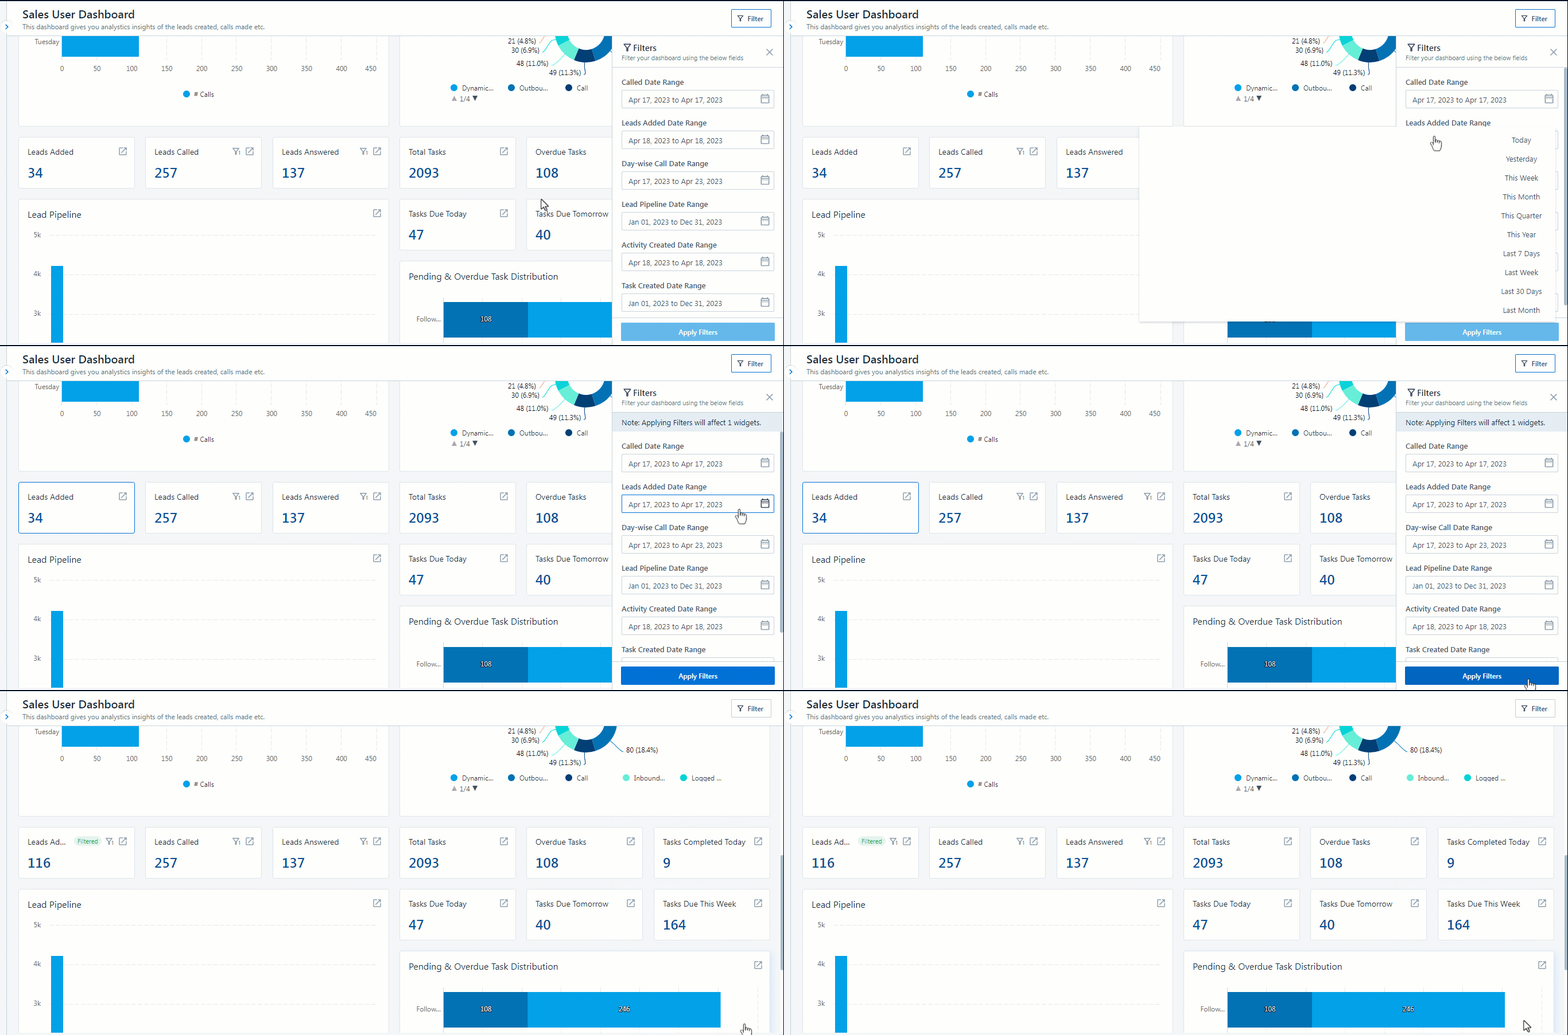
Click Filter to set a date range for metrics on your dashboard.
4.1 Called Date Range
The default date range for this filter is Today. The Called Date Range filter affects the following metrics –
| Metric | Description |
| Total Calls | Total calls dialed (Inbound + Outbound) in the date range |
| Total Call Duration | The summation of call duration of all calls dialed in the date range |
| Average Call Duration | The average call duration dialed (Total Call Duration / Total Calls) in the date range |
| Calls Connected | Total calls answered (Inbound + Outbound) in the date range |
| Inbound Missed Calls | Total inbound calls missed by the agent in the date range |
| Outbound Unanswered Calls | Total outbound calls not answered by the lead in the date range |
| Hourly Call Data | The hour-wise calls dialed by the agent in the date range |
| Call Status Breakup | Total calls distributed by their status in the date range. |
| Leads Called | Total leads where the agent attempted to call in the date range |
| Leads Answered | Total unique leads who answered the call in the date range |
4.2 Leads Added Date Range Filter
The default date range for this filter is Today. The Leads Added Date Range filter affects the following metrics –
| Metric | Description |
| Leads Added | Total new leads created and assigned to the agent |
4.3 Day-wise Call Date Range Filter
The default date range for this filter is the Current Week. The Day-wise Call Date Range filter affects the following metrics –
| Metric | Description |
| Day-wise Call | Total number of calls placed each day in the date range |
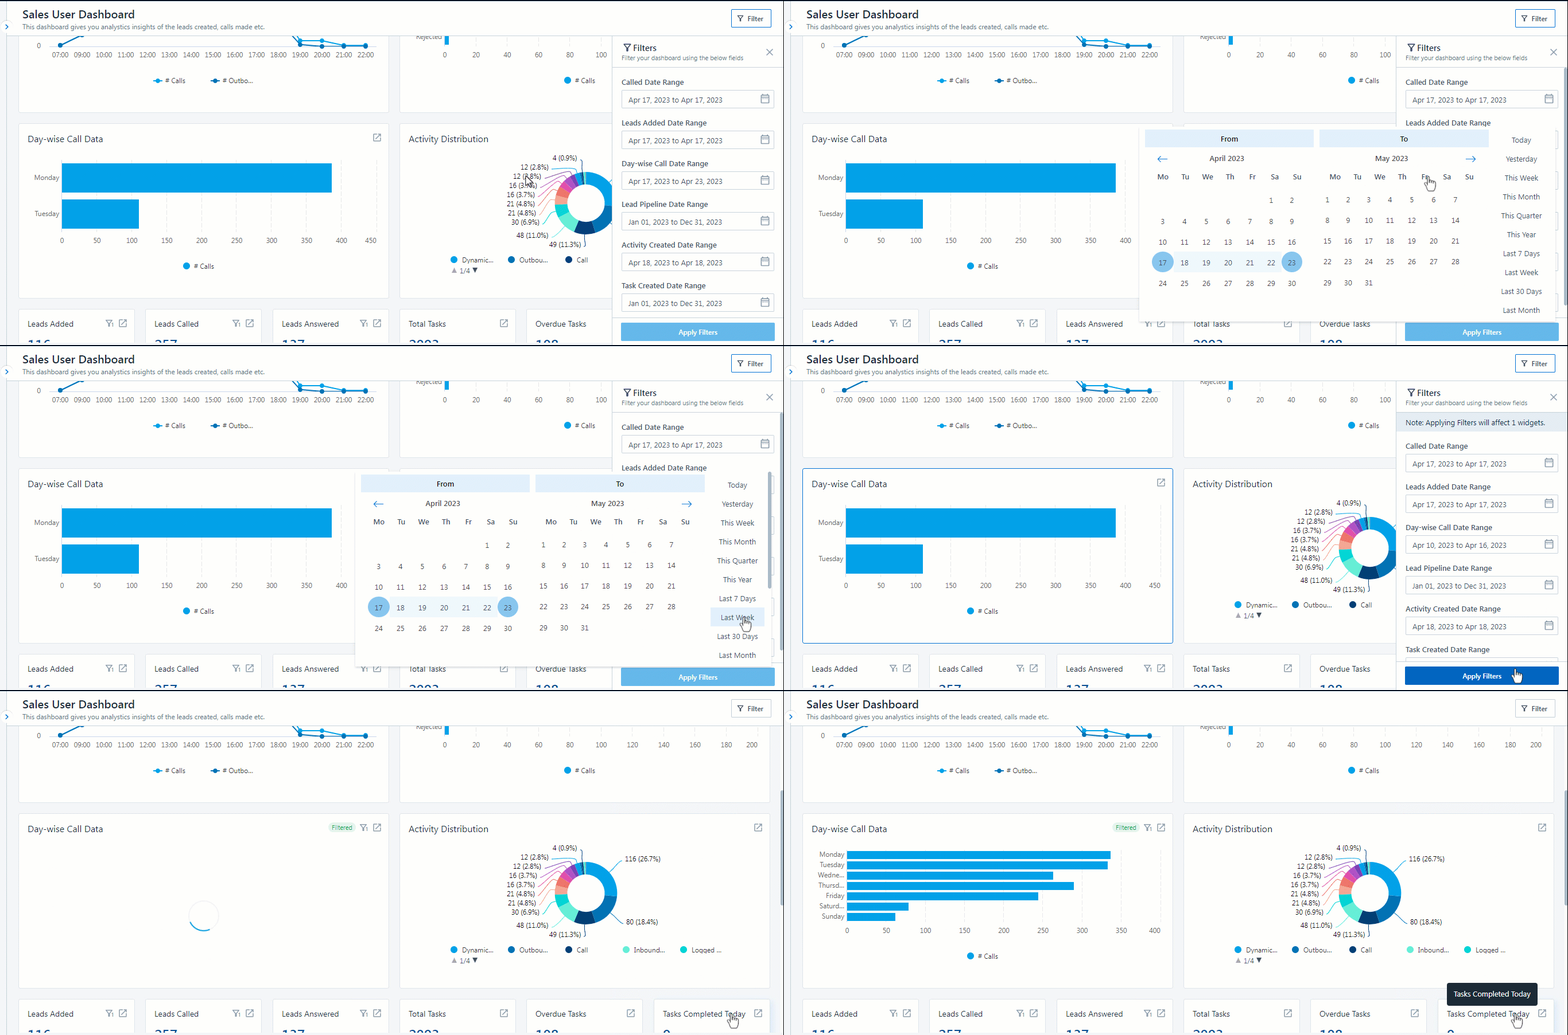
4.4 Lead Pipeline Date Range Filter
The default date range for this filter is the Current Year. The Lead Pipeline Date Range filter affects the following metrics –
| Metric | Description |
| Lead Pipeline Date Range | Total number of leads in different stages of your lead pipeline in the date range |
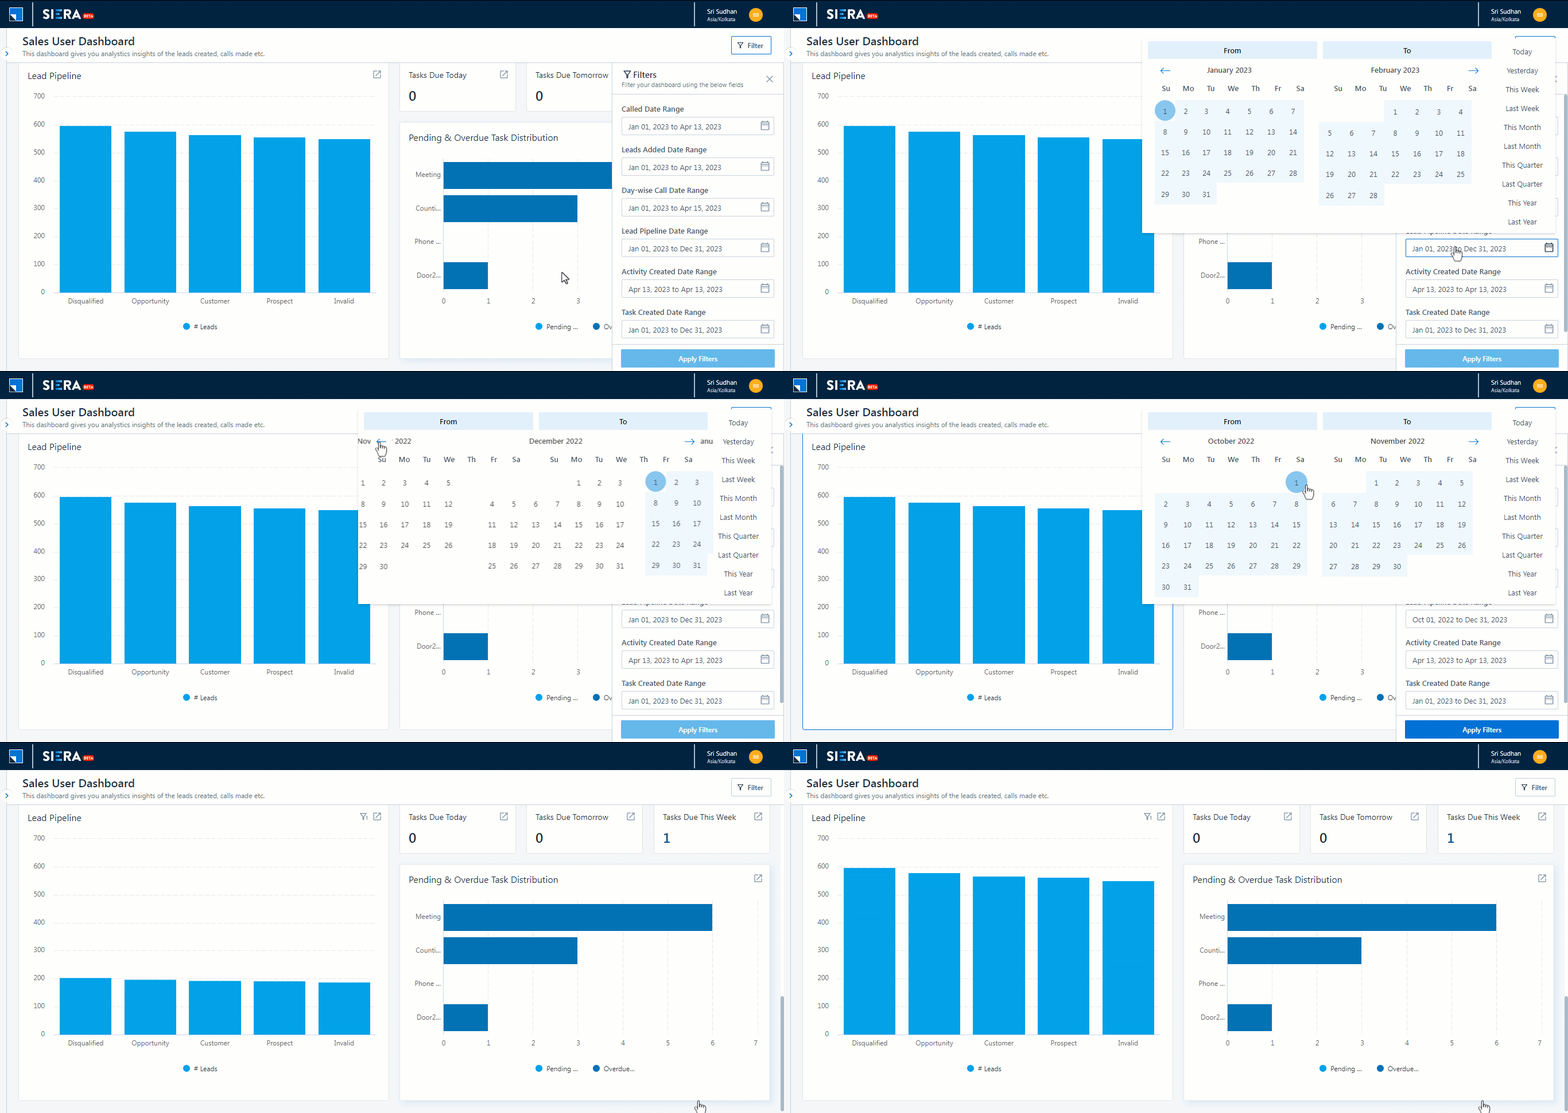
4.5 Activity Created Date Range Filter
The default date range for this filter is Today. The Activity Created Date Range filter affects the following metrics –
| Metric | Description |
| Activity Created Date Range | Displays a distribution of all the activities done by the agent on their leads in the date range |
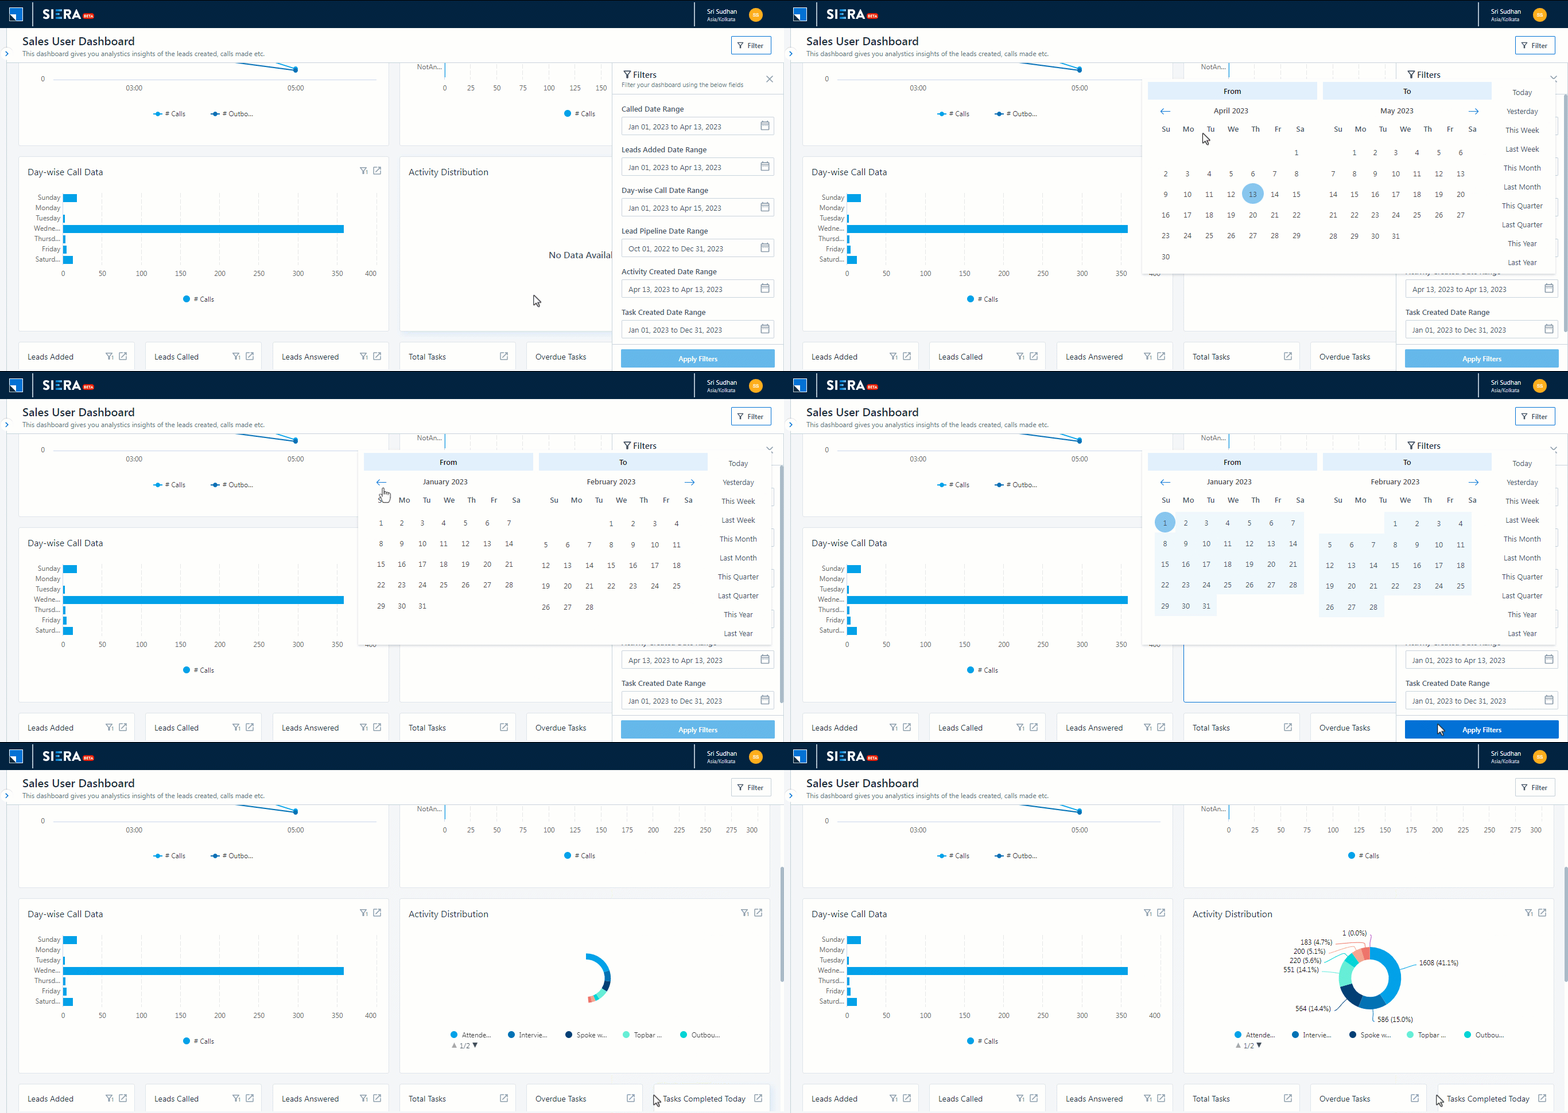
4.6 Task Created Date Range Filter
The default date range for this filter is the Current Year. The Task Created Date Range filter affects the following metrics –
| Metric | Description |
| Total Tasks | Total tasks created and assigned to the lead in the date range |
| Overdue Tasks | Total tasks overdue in the date range |
| Tasks Completed Today | Total tasks completed today in the date range |
| Tasks Due Today | Total tasks due today in the date range |
| Tasks Due Tomorrow | Total tasks due tomorrow in the date range |
| Tasks Due This Week | Total tasks due this week in the date range |
| Pending & Overdue Task Distribution | Displays a distribution of tasks assigned to an agent by the different tasks type and overdue and pending status |
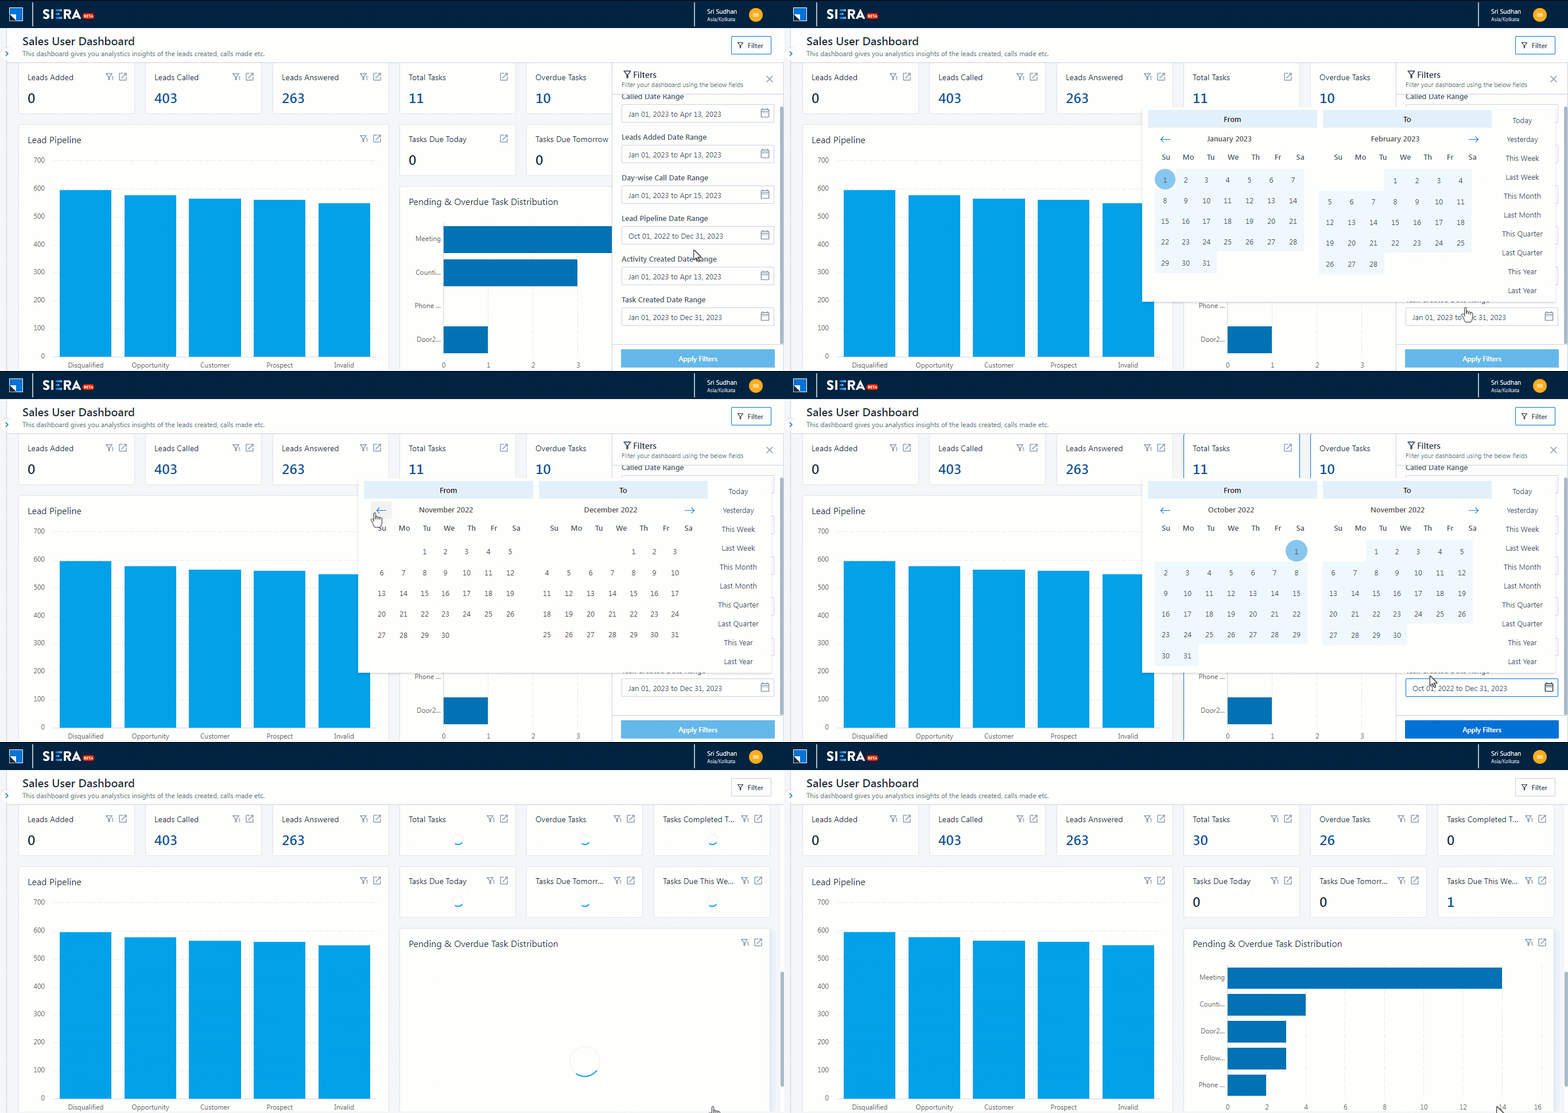
5. Filter Behaviour
When filtering your sales dashboard, you will come across the following filter behaviors –
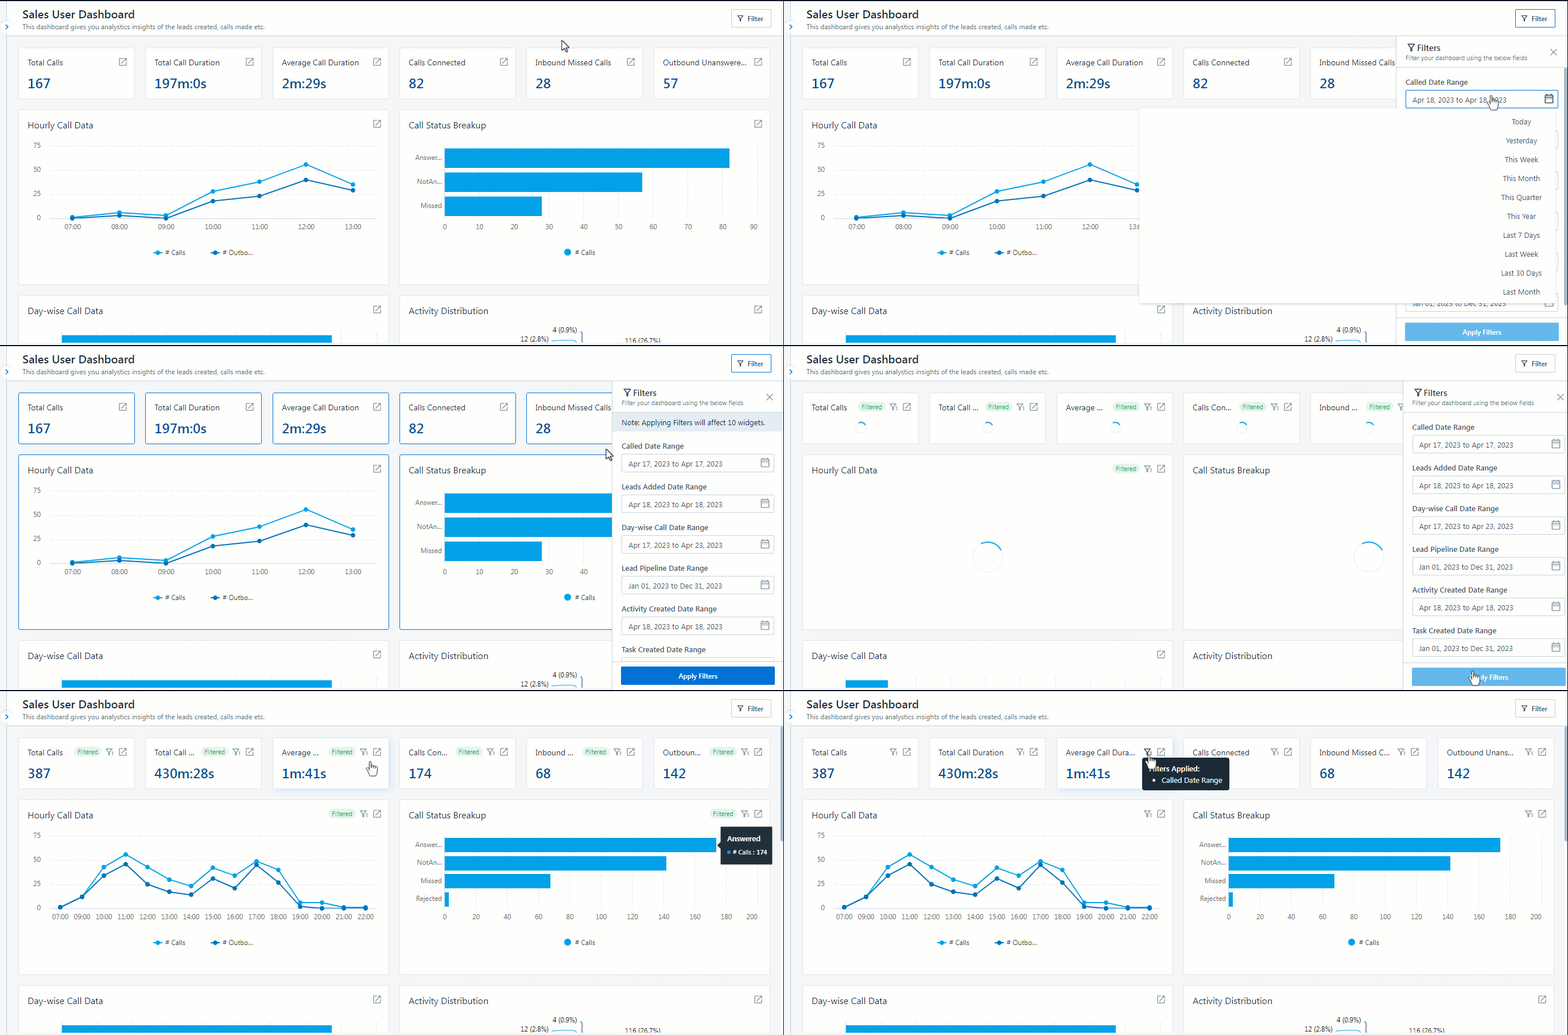
- Selecting a filter on a metric highlights the widgets it will impact.
- Once a filter is applied, the
 symbol will appear on the widgets it has impacted. The symbol will be visible for 5 seconds.
 - If a filter is applied by the user, the widgets will show the
 icon along with the subscript of the total filters applied. Clicking on the
  icon, shows the filters applied to the widgets.
6. Dashboard Drilldown and Report Redirection
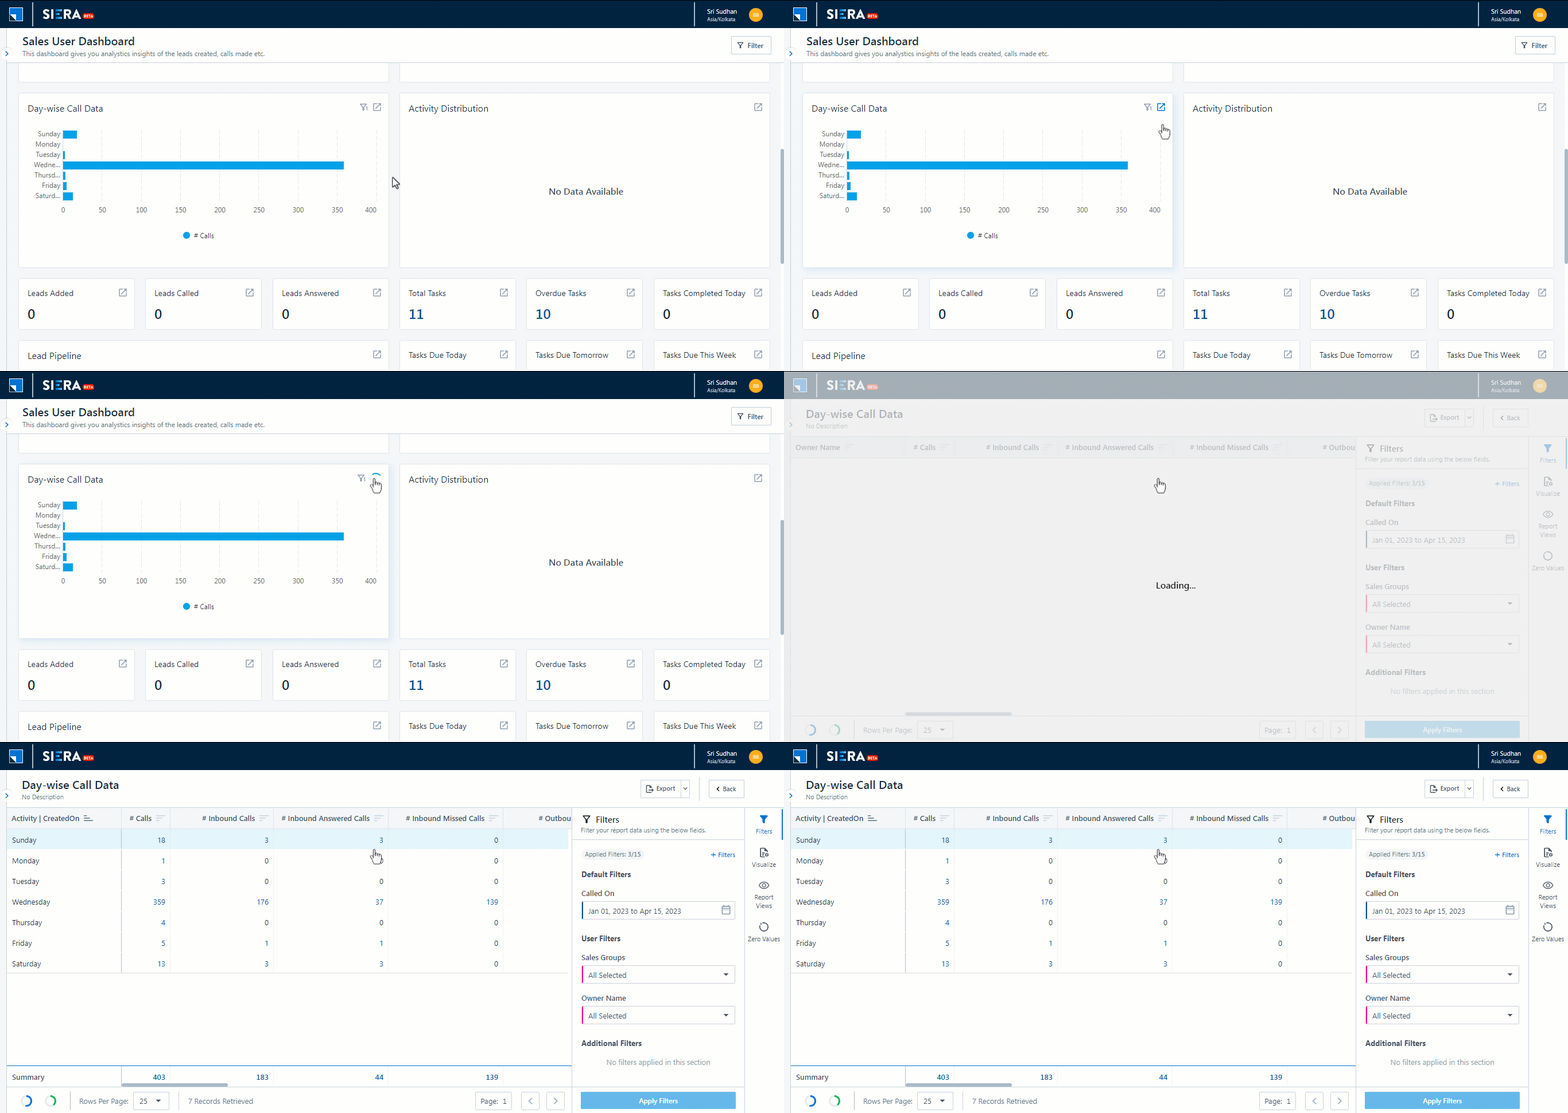
All Widgets can be drilled down at lead, task, activity, or call level to get the exact details or data. Clicking on the ![]() icon redirects the user to the report from where the data is fetched.
icon redirects the user to the report from where the data is fetched.
7. Add the Sales User Dashboard as Your Custom Report
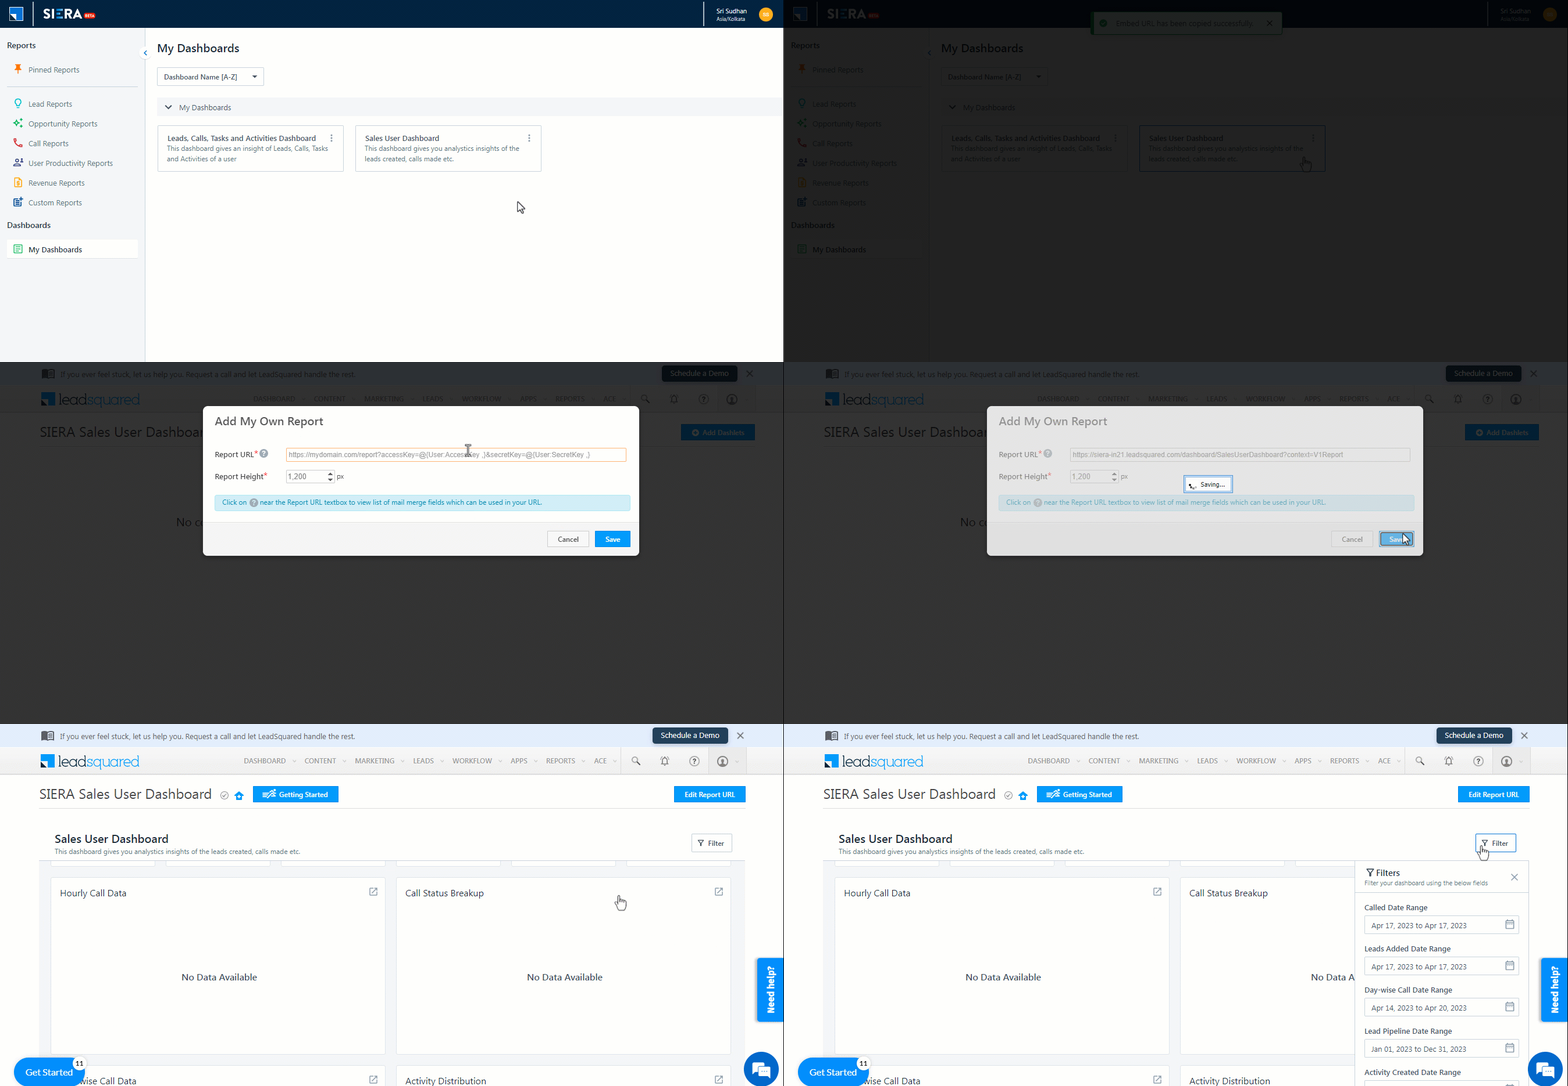
You can add the SIERA Sales User Dashboard to Your LeadSquared Dashboard –
- Navigate to Reports>SIERA>Dashboards>All Dashboards.
- Click on the
 icon againt the Sales User Dashboard and click Copy Embed URL.
 - Paste the link as an external report on the LeadSquared dashboard.
8. Add the Sales User Dashboard as a Custom Report For Your Users
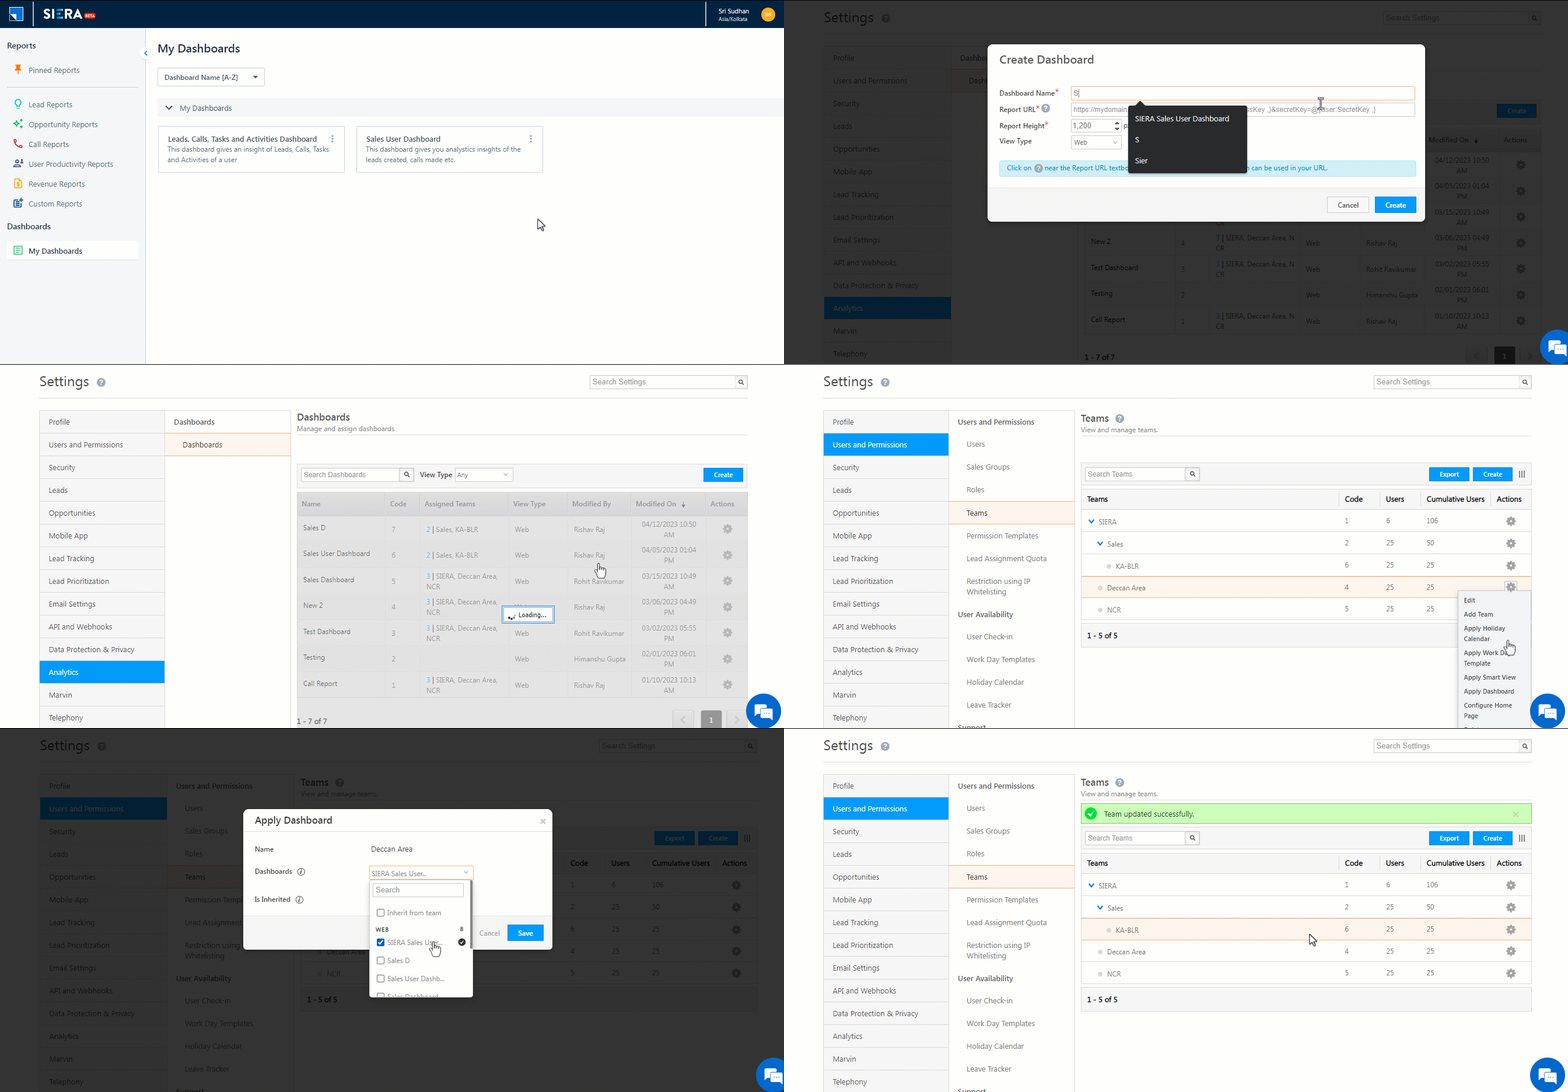
You can add the SIERA Sales User Dashboard to your users’ LeadSquared Dashboard –
- Navigate to Reports>SIERA>Dashboards>All Dashboards.
- Click on the
 icon againt the Sales User Dashboard and click Copy Embed URL.
 - Navigate to Settings>Analytics>Dashboards.
- Create a dashboard and paste the URL from the previous step.
- Navigate to Settings>Users and Permissions>Teams.
- Under Actions, Hover your mouse over the
 icon for a Team and click Apply Dashboard.
 - From the Dashboards drop-down, select the Dashboard you created.
- Click Save.
Any Questions?
If you have questions, let us know in the comments section. We’ll get back to you as soon as we can.
