1. Feature Overview
You can build Custom Dashlets to monitor lead stats straight from your dashboard. You can control who gets to access these dashboards and display specific dashlets to different users.
2. Prerequisites
- To install the Custom Dashlets Builder app, you have to be the Administrator of your LeadSquared account.
- Once the app is installed, Administrator & Marketing users can build/create custom dashlets and add them to the library for users to use/add these dashlets to their custom dashboards.
3. Types of Dashlets
- Lead Distribution by 1 Lead Field.
- Lead Distribution by 2 Lead Fields.
These Dashlets can be specifically created for 2 kinds of user roles –
- All Lead Access – Admin, Marketing & Sales Manager roles
- Restricted/Sales User Access – Sales Users roles.
Dashlets thus created will be available for users based on the lead access specified.
4. Installation
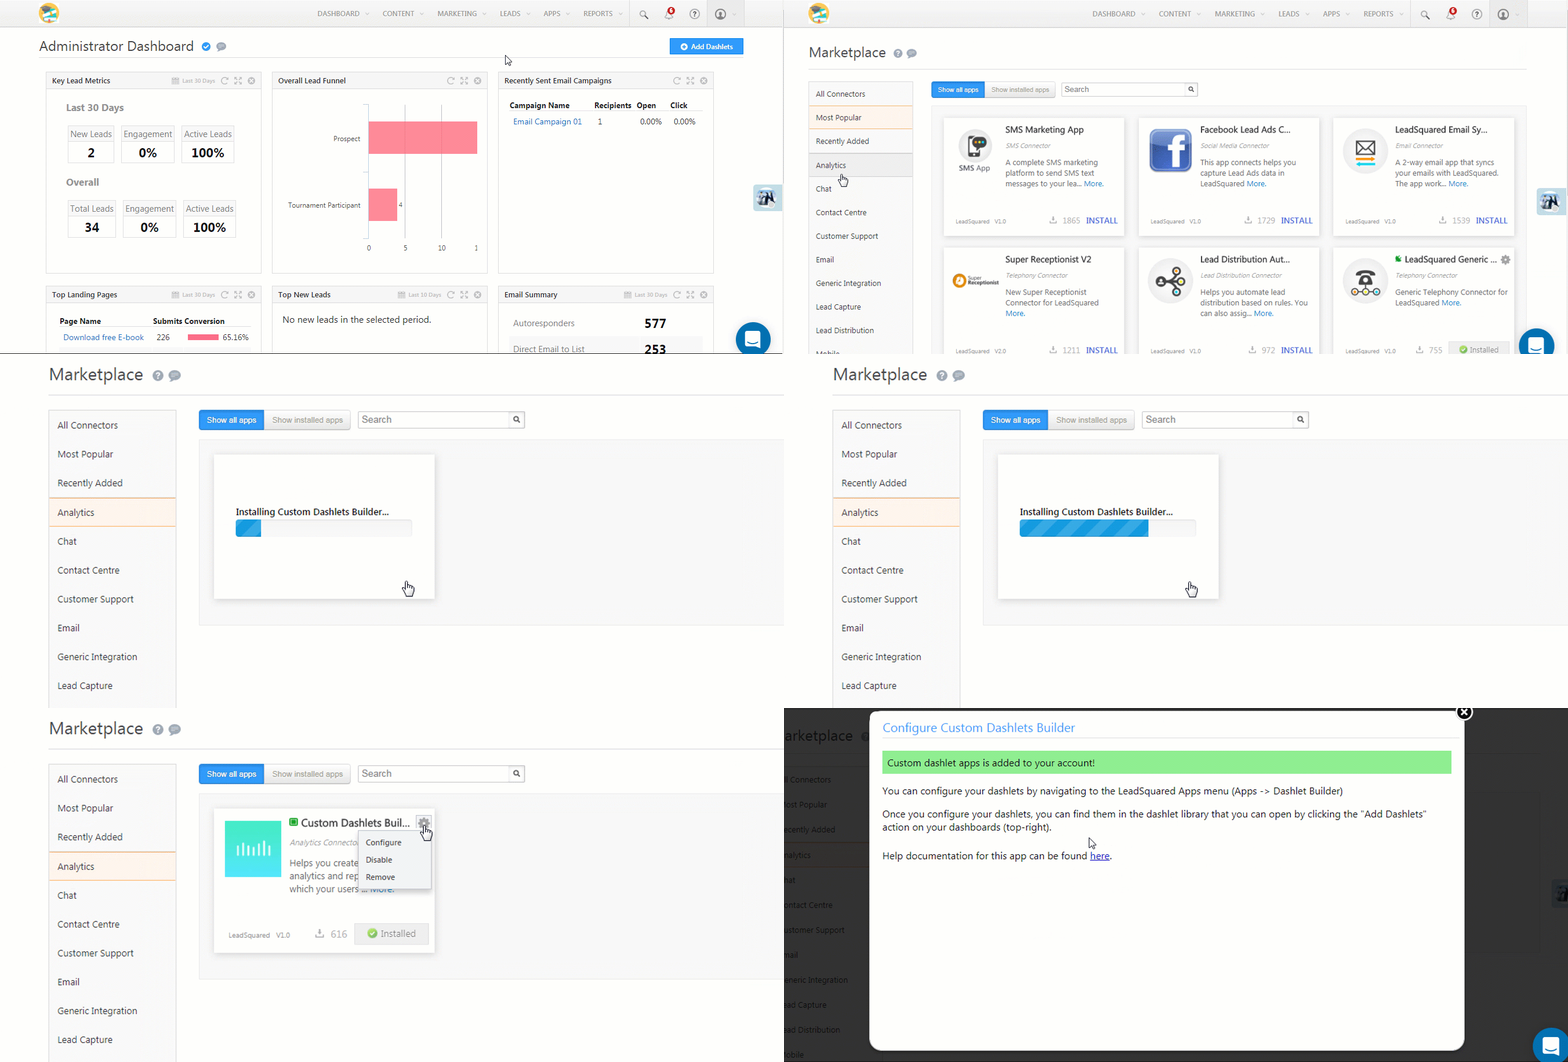
- From the main menu navigate to Apps>App Marketplace, select the Analytics Category and under the Custom Dashlets Builder app click Install. Alternatively, you could just search for the app directly from the Apps Marketplace.
- Once installed, hover the cursor over the Settings
 icon and click Configure.
5. Create a New Dashlet
Now that the app is installed, Admin/Marketing users can start building custom dashlets from Dashlet Builder available under the Apps Menu.
- On the main menu, navigate to Apps>Dashlet Builder.
- Click Add Dashlet.
- After filling in the necessary fields (described below), click Preview to see what your dashlet will look like.
- Click Save when you’re done.
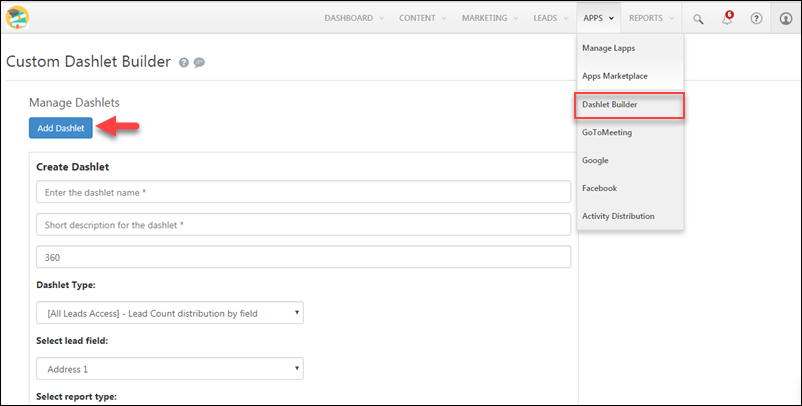
Here are the fields you need to populate to add a new dashlet –
| Field | Description |
| Name | Enter a name for the dashlet |
| Description | Enter a description |
| Height | Height of the dashlet in pixels. This helps dashlets with large content render better on your dashboard. 360 px is the default height. |
| Dashlet Type |
|
| Select Report Type | This option will only be available for the following dashlet types –
You can choose to render these dashlets in tabular form, as pie charts or as bar graphs. |
| Apply Fixed Filter | You can filter in or filter out the results by setting the appropriate filter for the dashlet. For example, if you wish to filter in/out leads of any specific Lead Stage you can add this filter. |
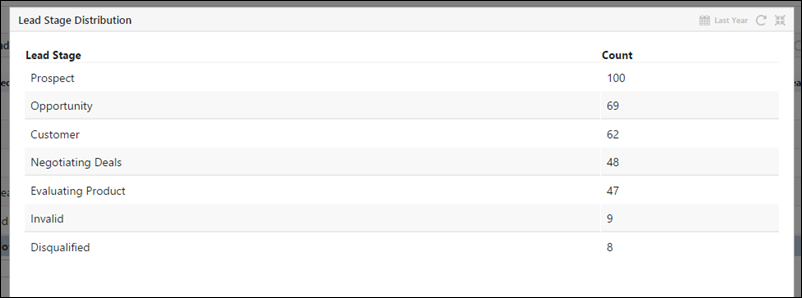
Here’s what a Lead Distribution by a Lead Field (Lead Stage) dashlet looks like –
And here’s an example of lead distribution by 2 Lead Fields (Lead Stage Vs Lead Source) –
6. Add a Dashlet to a Dashboard
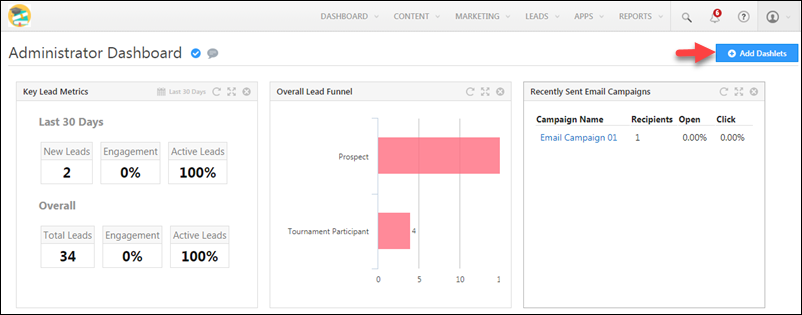
To add custom dashlets to dashboard, navigate to the dashboard and click Add Dashlet.
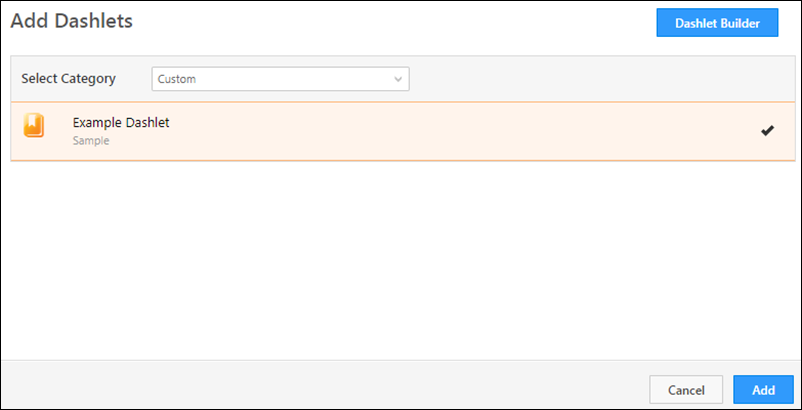
In the Add Dashlets pop-up, under Select Category, select Custom. Select your custom dashlet, then click Add.
For any queries, feel free to write to us at support@leadsquared.com.
Any Questions?
Did you find this article helpful? Please let us know any feedback you may have in the comments section below. We’d love to hear from you and help you out!


Can we create dashlets specific to deals?
Hi, Sai. I’m assuming by “deals” you mean “Opportunities”, if so then yes, you can create those dashlets –
1. Navigate to the Dashboard tab and click + Create new Dashboard.
2. Give this Dashboard a name and click on the dashlets link.
3. From the Select Category drop down, select Deals/Opportunity Management.
4. Select a Deals/Opportunity report.