Get Started
Sales Suite
Field Ops
Marketing
Service CRM
Integrations & Apps
FloStack
How to Track the Up-time and Service Status of the LeadSquared Application and APIs
If you’re having trouble accessing LeadSquared APIs, web or mobile applications, there’s a chance we’re currently experiencing a temporary problem.
You can check for outages and downtime on our status site – https://status.leadsquared.com
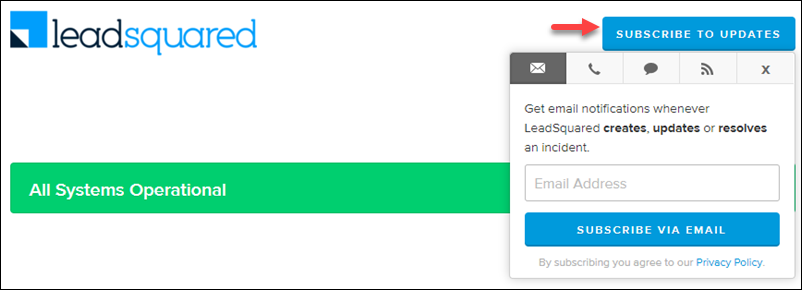
Be sure ‘Subscribe to Updates’ to get notifications whenever incidents are encountered and resolved –
- Click the Subscribe to Updates button.
- Choose the notification medium (email, phone, RSS feed, etc).
- Enter relevant details, then click the Subscribe button.
Up-Time Stats
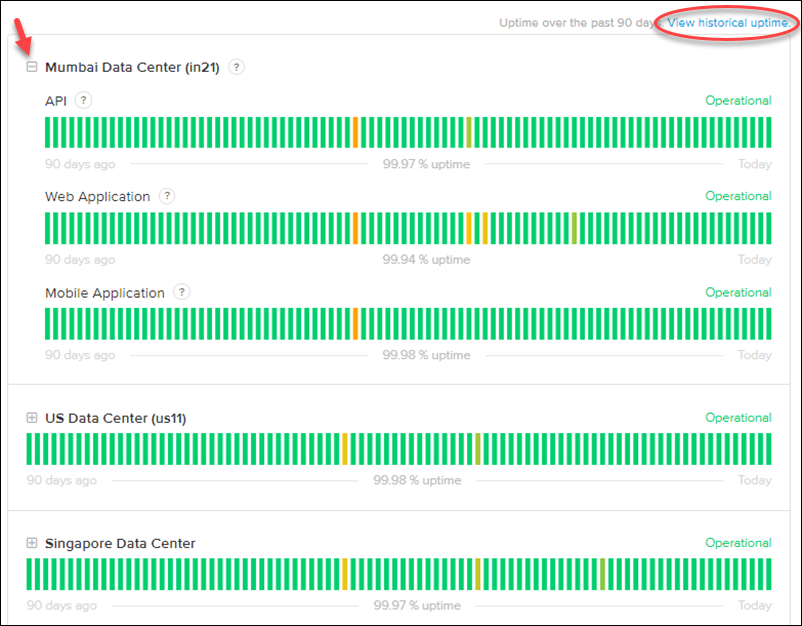
The up-time status is the first thing you’ll see as you scroll down the status page. Click on any region to view API, web and mobile application up-time statistics. Click the View historical uptime link to view up-time statistics preceding 90 days.
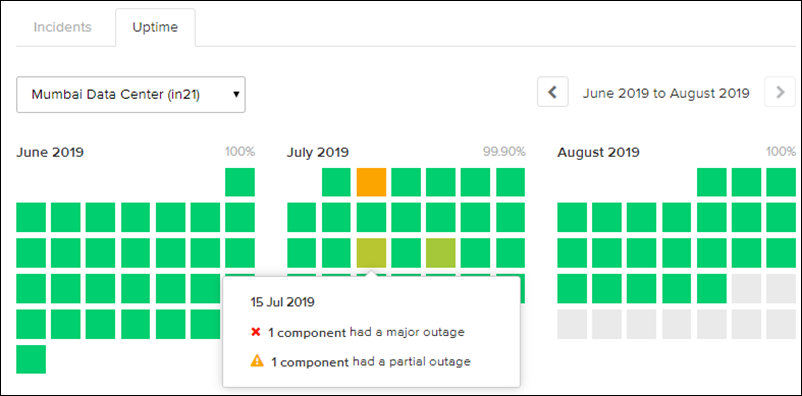
The historical up-time page represents the severity of each outage (major or partial) through different colours.
Hover your cursor over any block to view details of the outage. You can use the drop-down to select different regions and also scroll through different date ranges.
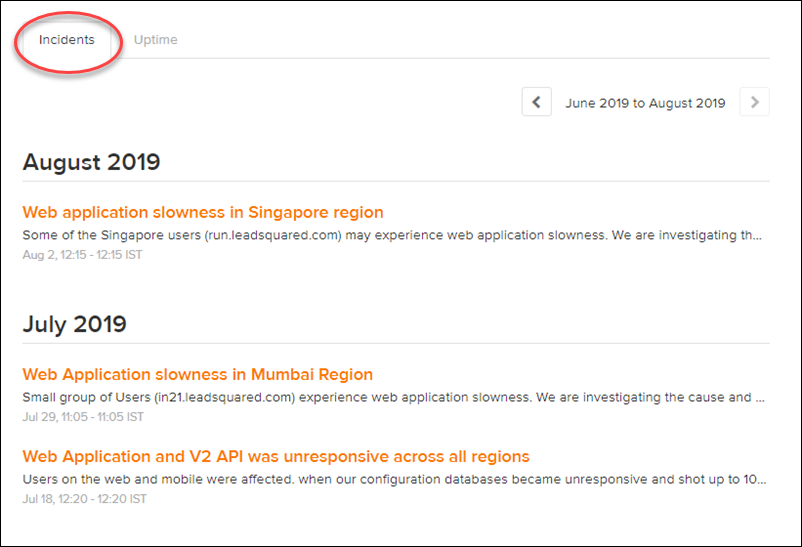
Click the Incidents tab to view the summary of all incidents.
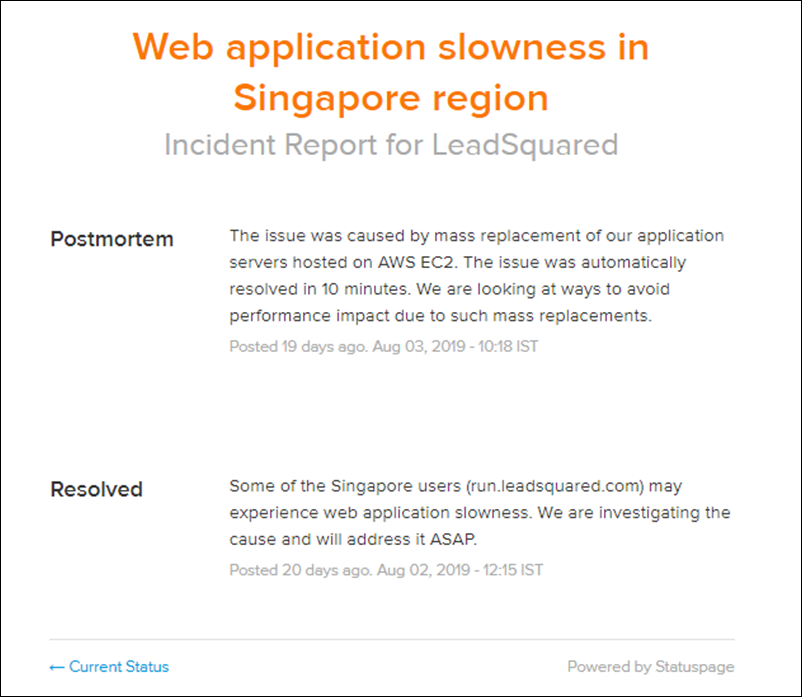
Click on a particular incident to view resolution and postmortem analysis details.
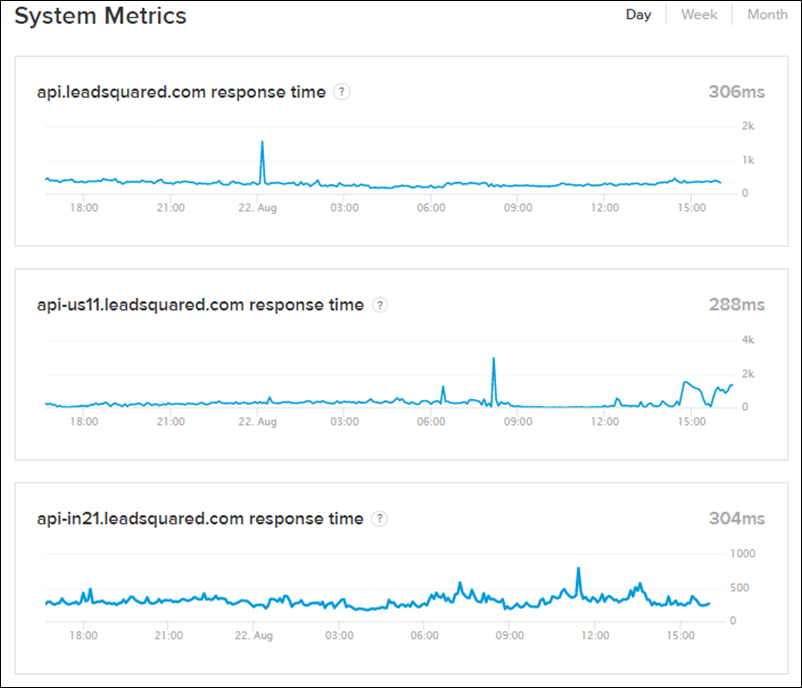
System Metrics
Scroll further down the status page to view API response times.