


Get Started
Sales Suite
Field Ops
Marketing
Service CRM
Integrations & Apps
FloStack
Lead Stage Distribution (Time-period wise) Report
Updated
24 May 2024 | 04:32 PM
LeadSquared’s Lead Stage Distribution allows you to view the number of leads allocated to a particular lead stage over a time period. This allows you to analyze the type of leads arriving in your LeadSquared system over a particular time period.
To access this Report:
- From your default LeadSquared dashboard, go to Reports -> Reports Home. The Reports Home window appears.
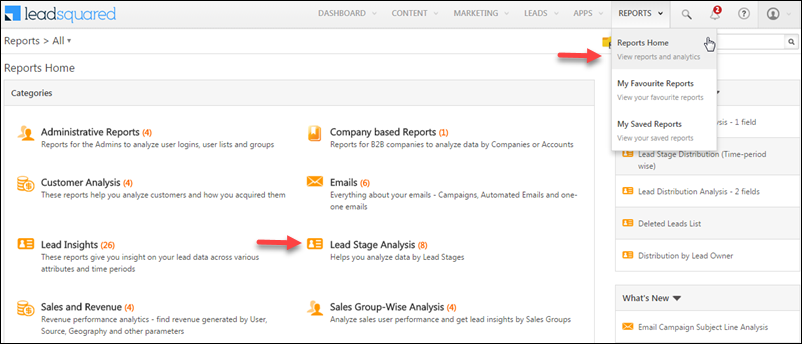
- Click Lead Stage Analysis under Categories. The Lead Stage Analysis window appears.
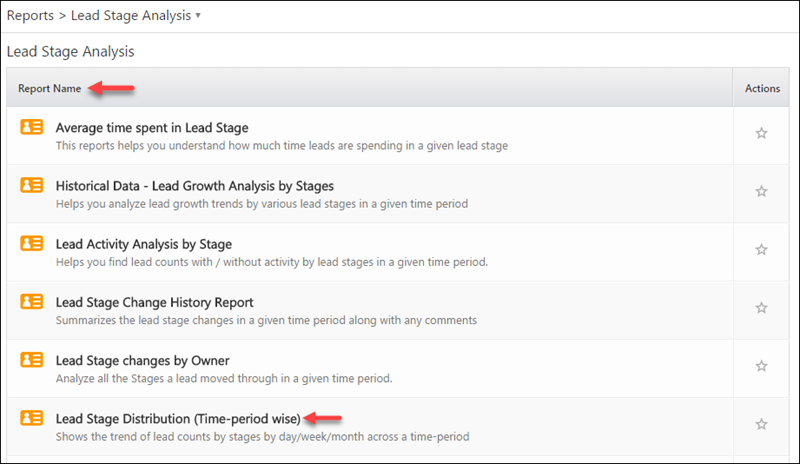
- Under Report Name, select Lead Stage Distribution (Time-period wise). The Lead Stage Distribution (Time-period wise) report appears.
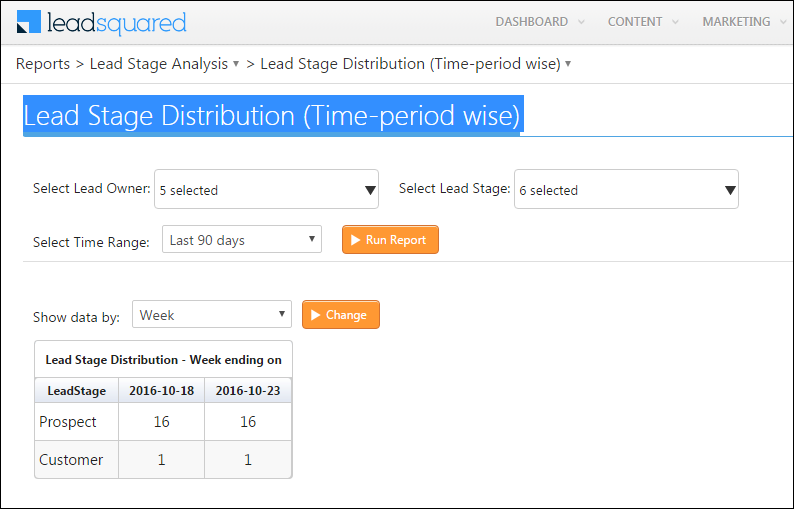
Complete the following details:
- Select Lead Owner – Select the Lead Owner from the multi-select drop-down list to view the number of leads which comes under the selected lead owners.
- Select Lead Stage – Select the Lead Stages from the multi-select drop-down list to view the number leads which comes under the selected lead stages.
- Select Time Range – Select the time range from the drop-down list to view leads which matches the selected lead owners, lead stages and under the selected time range.
Once the above details are completed, click Run Report. The number of leads which comes under the respective Lead Stages during the selected time period appears in tabular format.
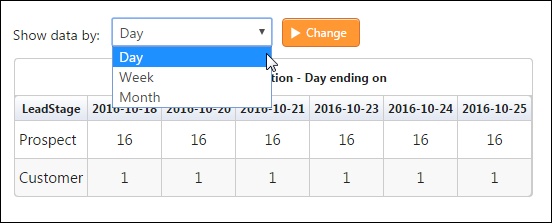
This data can be sorted in day, week or month based on the time range selected using the Show data by filter. Select the required option and click Change.
Lead stage distribution (time-perion-wise)
Not show in my leadsquared
How to enable
Hi, Palash.
Please reach out to support@leadsquared.com detailing the situation. We will get back to you ASAP.