


Get Started
Sales Suite
Field Ops
Marketing
Service CRM
Integrations & Apps
FloStack
Service Reports
1. Feature Overview
The Service Reports feature provides detailed insights into ticket metrics, helping you assess overall team efficiency, agent productivity, and SLA compliance. Generate reports based on various filters like time range, number of tickets generated, number of chat’s created, agent and group performance in handling these tickets and chats. These reports allow for trend analysis, identifying bottlenecks, and improving service quality by addressing and improving specific areas of concern.
The Reports page can be accessed by Admins, Supervisors, and Group Managers, who can use these metrics to optimize workflows and enhance the customer support experience. If you are a Group Manager, the Reports feature enables you to analyze the ticket-related performance of individual agents within your Service Group. If you are a Supervisor or Admin, you can analyze the performance of all agents in your organization.
2. Prerequisite
Only Service CRM Admins, Supervisors, and Group Managers can access Service Reports.
3. Access
To access the Service Reports page –
- Log in to your Service CRM account (https://marvin-in21.leadsquared.com/service-cloud).
- On the left menu panel, click
 .
. - You can now view ticket-related data on the Reports screen.
4. Ticket Volume Trends
The report displays the data as a bar graph, representing the number of incoming, resolved, and unresolved tickets that match the filters you’ve applied.

The Underlying Data section (at the bottom of the screen) lists all the tickets created within the selected Date Range, broken down by intervals. For example, suppose you’ve selected a 24-hour Date Range and the current time is 6 PM. In that case, it will list the tickets captured at 6 PM the previous day, 7 PM the previous day, and so on up to 5 PM on the current day, along with the number of resolved tickets, unresolved tickets, and the FCR%.
5. Agent Performance
This report provides a tabular representation of the tickets assigned to each agent that match the applied filters. It displays various metrics for each agent, such as the number of tickets assigned to them, the number of tickets to which they have added notes, and more.
6. Ticket Life Cycle
This report shows the average time tickets spend in the Open, In Progress, and On Hold stages, before moving to the next stage, for the selected time period and filters.
7. Group Performance
If you are a Group Manager, this report allows you to analyze your group’s ticket performance. If you are a Supervisor or Admin, you can analyze ticket performance across all groups in your organization.
8. Shared Ownership
This report analyzes ticket metrics when assigned to different groups using the Co-ownership feature. It shows the average time each group spent on the ticket, the average internal SLA for each group, and more. These insights help streamline workflows and improve ticket resolution times.
9. Chat Reports
Chat Reports provide insights into agent performance and customer interactions on chat’s created through the Chat Channel. These reports display metrics like total chats, average response time, average resolution time, and more.
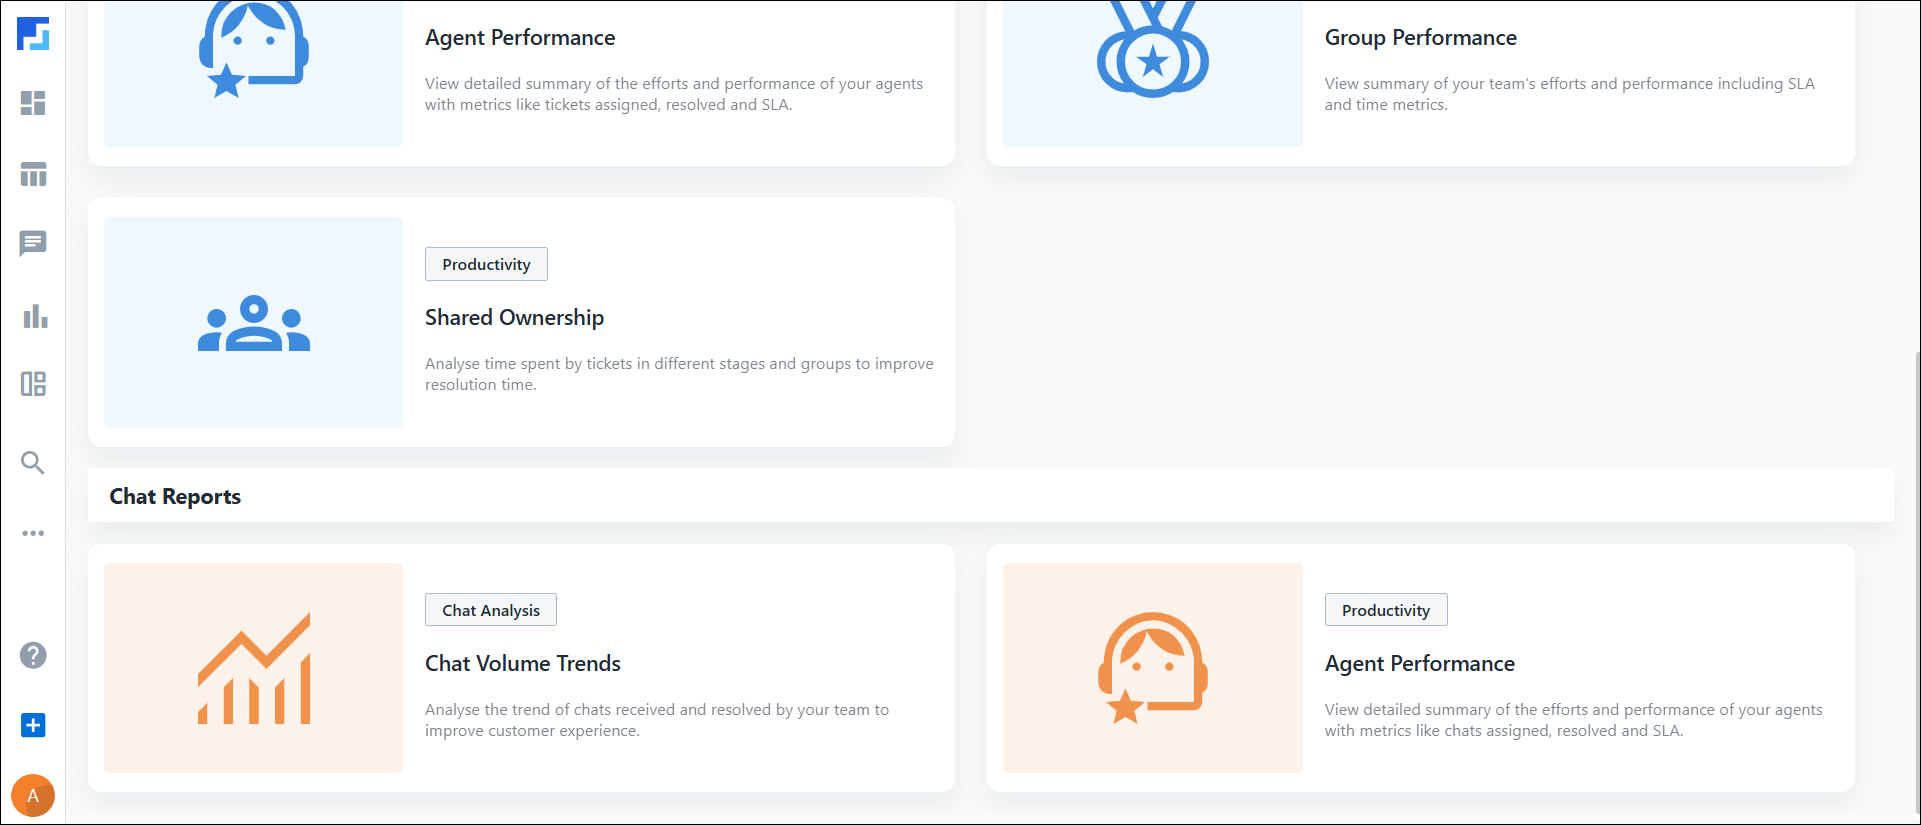
9.1 Chat Volume Trends
Chat Volume Trends display the average first response time and resolution time for chats created within the selected time period, Service Groups, and agents. You can also view the total and unique conversations created and assigned based on the applied filters. This report can be filtered by day (Monday, Tuesday, etc.) or by date (19th, 20th, etc.).
- Unique Conversation represents the number of distinct customers who initiated chats during the selected time period.
- For example, if you filter the report for 24 hours, and John starts a conversation at 11 AM and another at 5 PM, it is counted as only one unique conversation. Similarly, if Paul, George, and Ringo also initiate chats within the same 24-hour window, regardless of how many times each of them starts a conversation, the total unique conversations would be four.
- Average Wait Time is the average amount of time a customer had to wait before getting a response from your agent.
9.2 Agent Performance
This report shows a table of chats assigned to each agent based on the applied filters. It displays key metrics for each agent, such as the number of chats assigned, unique chats during the selected period, average first response time, and more. You can filter the report by Service Groups, agents within a Service Group, or individual agents.
- Unique Conversation represents the number of distinct customers who initiated chats during the selected time period that were handled by the agent.
- For example, if you filter the report for 24 hours, and John starts a conversation at 11 AM and another at 5 PM, it is counted as only one unique conversation. Similarly, if Paul, George, and Ringo also initiate chats within the same 24-hour window, regardless of how many times each of them starts a conversation, the total unique conversations would be four.
- Average Wait Time is the average amount of time a customer had to wait before getting a response from your agent.

9.3 Agent Availability
For the applied filters, this report shows the number of days each agent marked themselves as Available on the chat screen, and their average available time across all these days.
9.4 CSAT
This report shows the average CSAT rating for each agent within the selected time period. You can filter the results by agents or Service Groups, and view the report either date-wise or agent-wise.

9.5 Chat Disposition Report
This report shows the consolidated view of customer sentiment, along with the total chats handled and the number of chats created under each issue type. You can filter the report by agents or Service Groups, and view the report either date-wise or day-wise. This report is generated based on the Chat Disposition form configured on your account.
10. Report Filters
Apply the following filters across all the reports mentioned above –
- Date Range – Filters ticket data for different time periods (such as “This Month,” “Last Week,” “24 hours,” etc.). You can also choose a custom time period, as long as the interval between the start date does not exceed 6 months from the current date (for example, if the current date is August 1st, the start date cannot be before February 1st).
- Group – Filters ticket performance based on the groups to which tickets are assigned. Group Managers can only view their group’s performance, while Supervisors and Admins can view the performance of any group in the account.
- Agent – Filters ticket performance for individual agents or a set of agents in your organization. Group Managers can only view agents who are part of their groups.
- Channel – Filters tickets based on the channels through which they were created.
- Priority – Filters tickets based on the priority levels available in your account.
- Type – Filters tickets based on the ticket types.
Note:
- You can add multiple filters to a report.
- You can select multiple options under each filter type.
11. Export Reports
On the Reports screen, click the Export as CSV button to export the reports you’re currently viewing.
Any Questions?
Did you find this article helpful? Please let us know any feedback you may have in the comments section below. We’d love to hear from you and help you out!