


Get Started
Sales Suite
Field Ops
Marketing
Service CRM
Integrations & Apps
FloStack
Service Dashboards
1. Feature Overview
Dashboards provide a visual representation of ticket data, allowing you to track performance trends, monitor SLA achievement, and identify areas for improvement. By offering real-time insights, they help you and your team make data-driven decisions, prioritize tasks, and ensure efficient customer service.
Admins, Supervisors, Group Managers, and Agents can access the Dashboards page. Admins and managers can use dashboards to evaluate team productivity and optimize resource allocation, while agents can track their progress and performance.
2. Access and Permissions
To access the Dashboard screen –
- Log in to your Service CRM account (https://marvin-in21.leadsquared.com/service-cloud).
- On the left menu panel, click
 .
. - You can now view ticket-related data on the My Dashboards screen.
Each role comes with a set of predefined permissions, as listed below –
- Agents can view performance data for tickets assigned to them.
- Group Managers can view performance data for tickets assigned to them and their group members.
- Supervisors and Admins can view performance data for all tickets in their account, across all groups and user roles.
3. Filters
Filters allow you to customize data based on specific parameters. You can filter tickets to focus on particular time periods, ticket statuses, priority levels, and more. Filters also let you analyze individual agent and service group performances, which helps improve efficiency and productivity. You can apply the following filters on the Dashboards page –
3.1 Date Range
Filter the Dashboard across the following time frames –
- Last 24 hrs – Displays ticket performance data from the past 24 hours. If you apply this filter at 4 PM today, you’ll see data from 4 PM yesterday to 4 PM today.
- Today – Displays ticket performance data for the current calendar day (i.e., starting from 12 AM today).
- Yesterday – Displays data for the previous calendar day, starting from 12 AM yesterday to 11:59 PM yesterday.
- Last 7 days – Presents data for the last 7 days, starting from yesterday. For example, if today is August 10th, this option covers data from August 3rd, 12 AM, to August 9th, 11:59 PM.
- Last 30 days – Provides data for the last 30 days, starting from yesterday. For example, if today is July 2nd, this option covers data from June 2nd, 12 AM, to July 1st, 11:59 PM.
- Custom – Select a custom date and time range to view the ticket data. You can select a date range of up to six months from the current day.
After selecting the date range, click Apply.
3.2 Groups
Allows you to filter tickets and view ticket performance based on the Service Groups to which these tickets were assigned. Unassigned tickets is also listed as an option.
Note:
- You can select multiple groups when applying this filter.
- Agents and Light Agents will not have access to this filter.
Only Group Managers, Supervisors, and Admins can use this filter.
Group Managers can only view their own groups. When they select a group from the dropdown, they can also choose specific agents within that group.
After selecting the date range, click Apply.
3.3 Agent
This filter allows you to view ticket-related metrics for individual agents or a group of agents in your organization. Only Group Managers, Supervisors, and Admins can use this filter. Group Managers will only be able to view agents within their assigned groups.
After selecting the date range, click Apply.
Note:
- Agents will not have access to this filter.
- Select multiple agents when applying the filter.

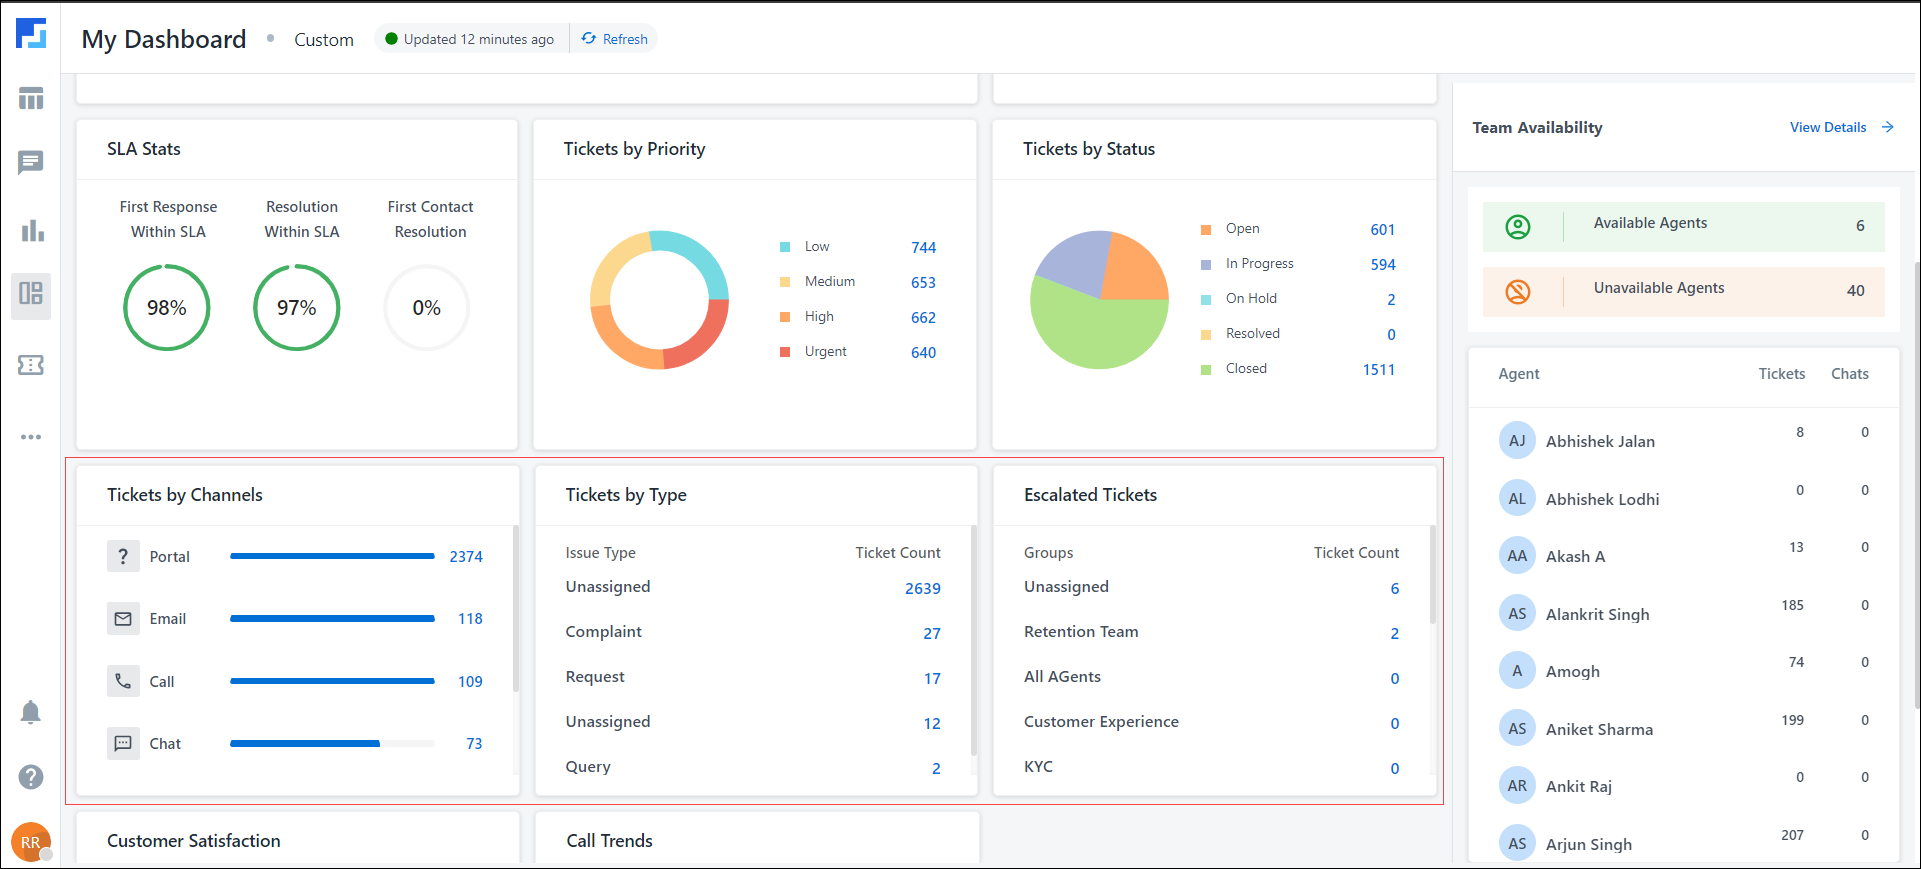
4. Team Availability Dashboard
This dashboard gives Supervisors and Admins control over their agents’ availability. For example, even if an agent has checked out for the day, the Admin or Supervisor can select agents from a Service Group or an individual agent and mark them as Available.
Note:
- This feature will work only if the Check-in/Check-out feature is enabled on your account.
- This feature overrides the availability that the agent has set for themselves.
4.1 Prerequisite
Before you conifgure this feature, it is mandatory to complete the following steps –
- Log in to the LeadSquared Sales CRM platform (https://identity.leadsquared.com/).
- Navigate to My Profile>Settings>Profile>Advanced Configurations.
- Here, search for Check-in/Check-out status configuration, and click Configure.
- On the Check-in/Check-out status pop-up, edit
 the following statuses, and set –
- The Online status to Available
- The Away status to Unavailable
- Once you’re done, click the save icon
 , and then click Save. You can now configure the Team Availability Dashboard.
4.2 Configure Team Availability
- Log in to the Service CRM platform (https://marvin-in21.leadsquared.com/service-cloud), and navigate to the My Dashboard screen, and click Team Availability.
- On the Team Availability page, filter by the Service Group and/or the Agent whose availability you want to update.
- Once you’re done, click Apply.
- From the Agent Availability column, click the agent’s current status, and select the desired status from the available options.
- The agent’s availability status is now updated.
4.3 Dashboard Metrics
Here, you can view the following metrics –
- Assigned Tickets – The total number of tickets assigned to this agent.
- Closed Tickets – The total number of tickets closed by this agent.
- Assigned Chats – The total number of chats assigned to this agent.
- Closed Chats – The total number of chats closed by this agent.
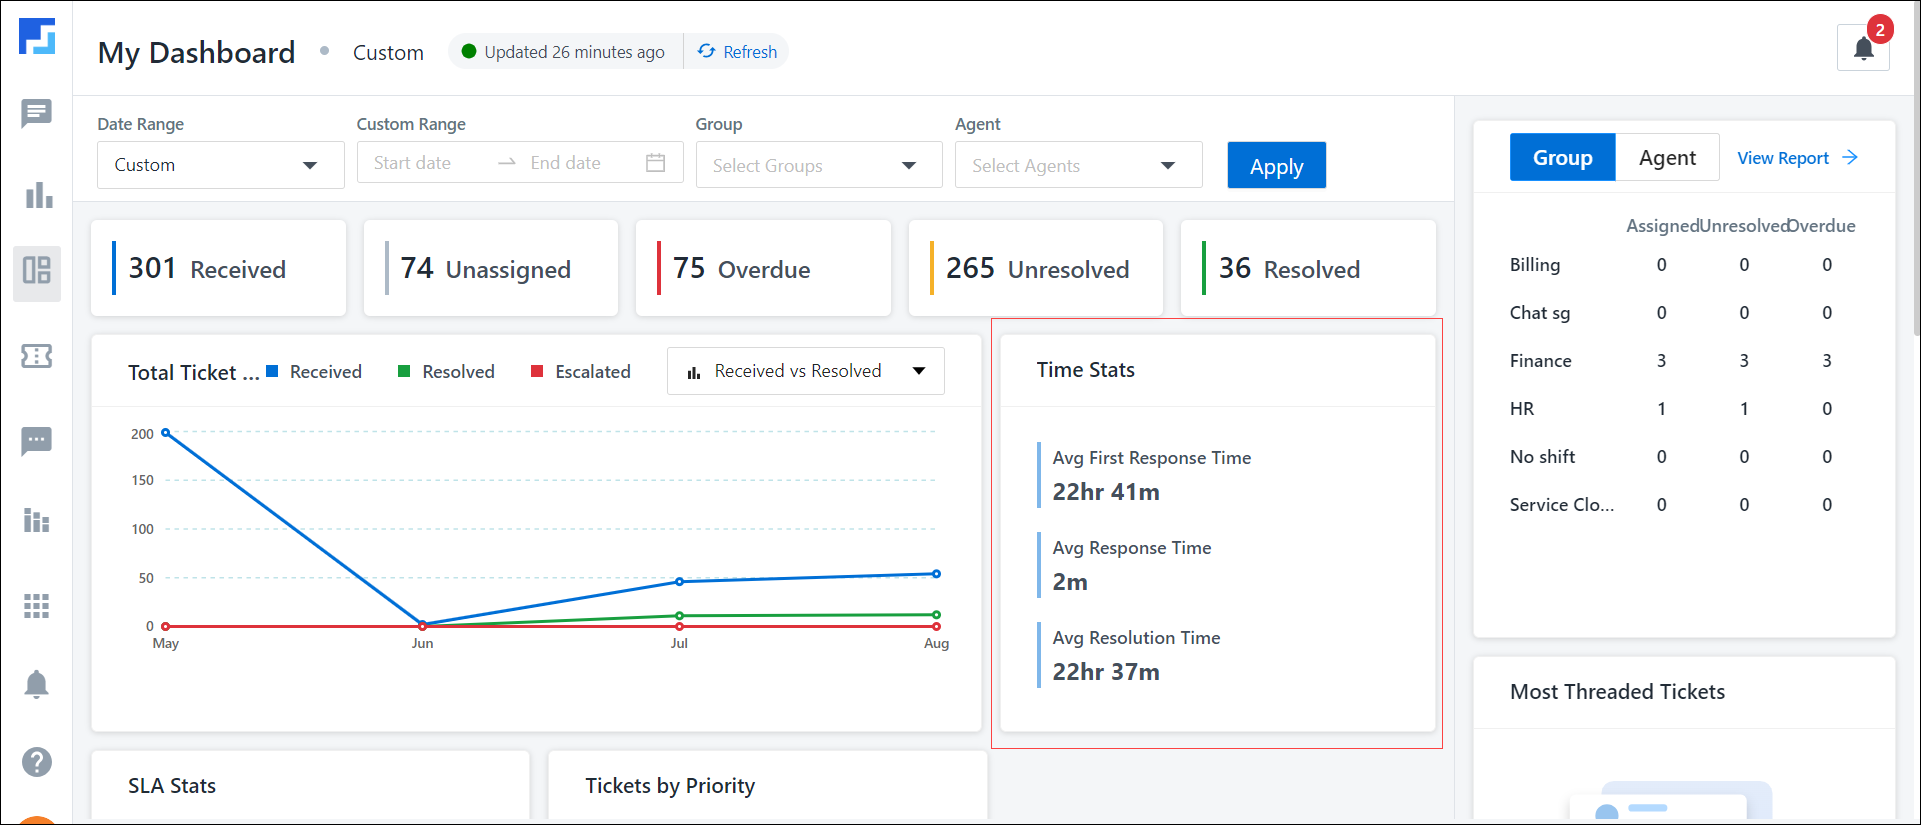
5. Other Dashboard Metrics
The following metrics are available on the Dashboard screen –
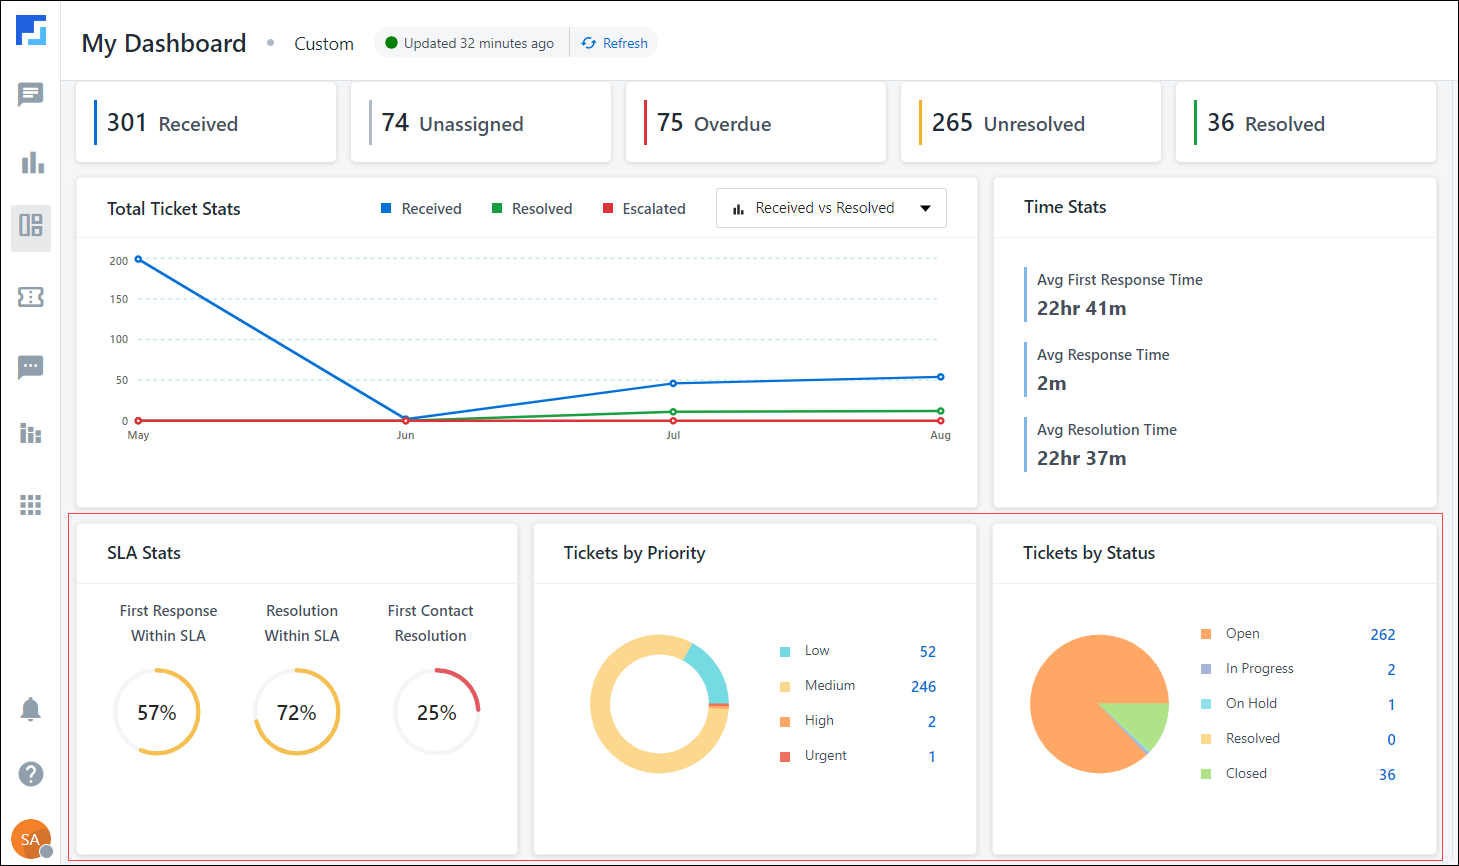
- Dashboard Tiles – The following display tiles show –
- New Tickets – New tickets created based on the filters applied.
- Unassigned – Unassigned tickets in your account based on the applied filters.
- Due Today – Tickets with resolution SLAs due on the current day.
- Overdue – Tickets that have breached their resolution SLA.
- Unresolved – Unresolved tickets in your account that match the applied filters.
- Resolved – Resolved tickets in your account that match the applied filters.
- Total Ticket Stats – Displays the total number of tickets for the selected date range. You can also filter the graph by –
- Received vs Resolved – Plots the total number of tickets received against the total number of tickets resolved within the selected date range, displayed as a line graph.
- Unresolved vs Overdue – Displays the total number of unresolved tickets versus the total number of overdue tickets within the selected date range, shown as a bar graph.
- Time Stats – This tile contains details about the time taken to resolve tickets that satisfy the applied filters –
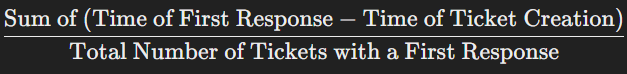
- Average First Response Time – This measures the average time taken to respond to a new ticket. The time displayed is based on the working hours defined in your account’s SLA policy. For example, if your workday is defined as 9 AM to 5 PM, and the average first response time shows 10 hours, it means the first response is sent on Day 2 at 11 AM. This is calculated using –
Sum of (Time of First Response - Time of Ticket Creation)/ Total Number of Tickets with a First Response
- Average Response Time – The average time taken to respond to emails received on a ticket. For example, if responses are sent every 3 hours, the average response time would be 3 hours. This is calculated using –
Sum of (Outgoing Response Timestamp - Incoming Response Timestamp) / Total Responses Sent in the Timeframe

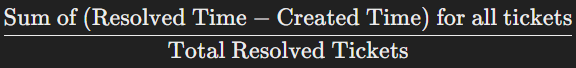
- Average Resolution Time – The average time taken to resolve tickets. This is calculated using –
Sum of (Resolved Time – Created Time) for all tickets / Total Resolved Tickets
- Average First Response Time – This measures the average time taken to respond to a new ticket. The time displayed is based on the working hours defined in your account’s SLA policy. For example, if your workday is defined as 9 AM to 5 PM, and the average first response time shows 10 hours, it means the first response is sent on Day 2 at 11 AM. This is calculated using –
- SLA Stats – This tile provides information on SLA resolution for tickets that match the applied filters –
- First Response within SLA – The percentage of tickets for which the first response time is within the first response SLA defined in your account. This is calculated using –
(Number of Tickets that Received a First Response Within SLA / Total Tickets with a First Response) x 100

- Resolution within SLA – The percentage of tickets resolved within the resolution SLAs set up in your account. This is calculated using –
(Number of Tickets Resolved or Closed Within Resolution SLA Time / Total Tickets Resolved) x 100

- First Contact Resolution – The percentage of tickets resolved during the initial contact with the customer. This is calculated using –
(Number of Tickets Resolved or Closed Within First Response / Total Tickets Resolved) x 100
- First Response within SLA – The percentage of tickets for which the first response time is within the first response SLA defined in your account. This is calculated using –
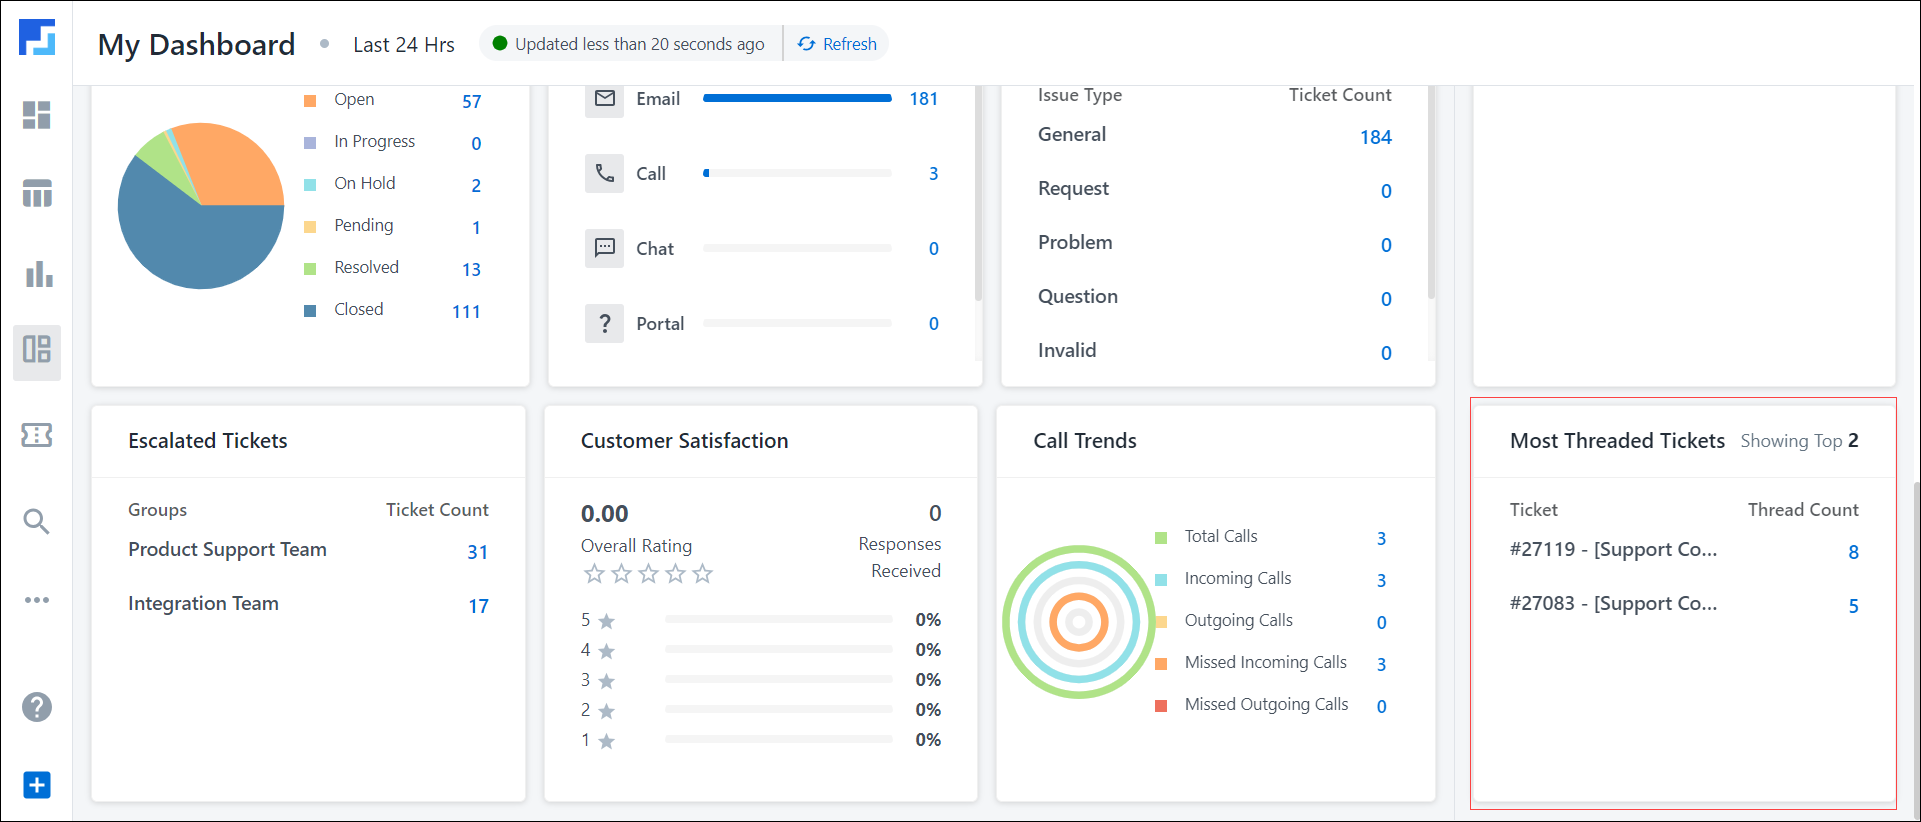
- Tickets by Priority – Displays the tickets that match the applied filters, categorised by Ticket Priority.
- Tickets by Status – Displays the tickets that match the applied filters, categorised by Ticket Status.
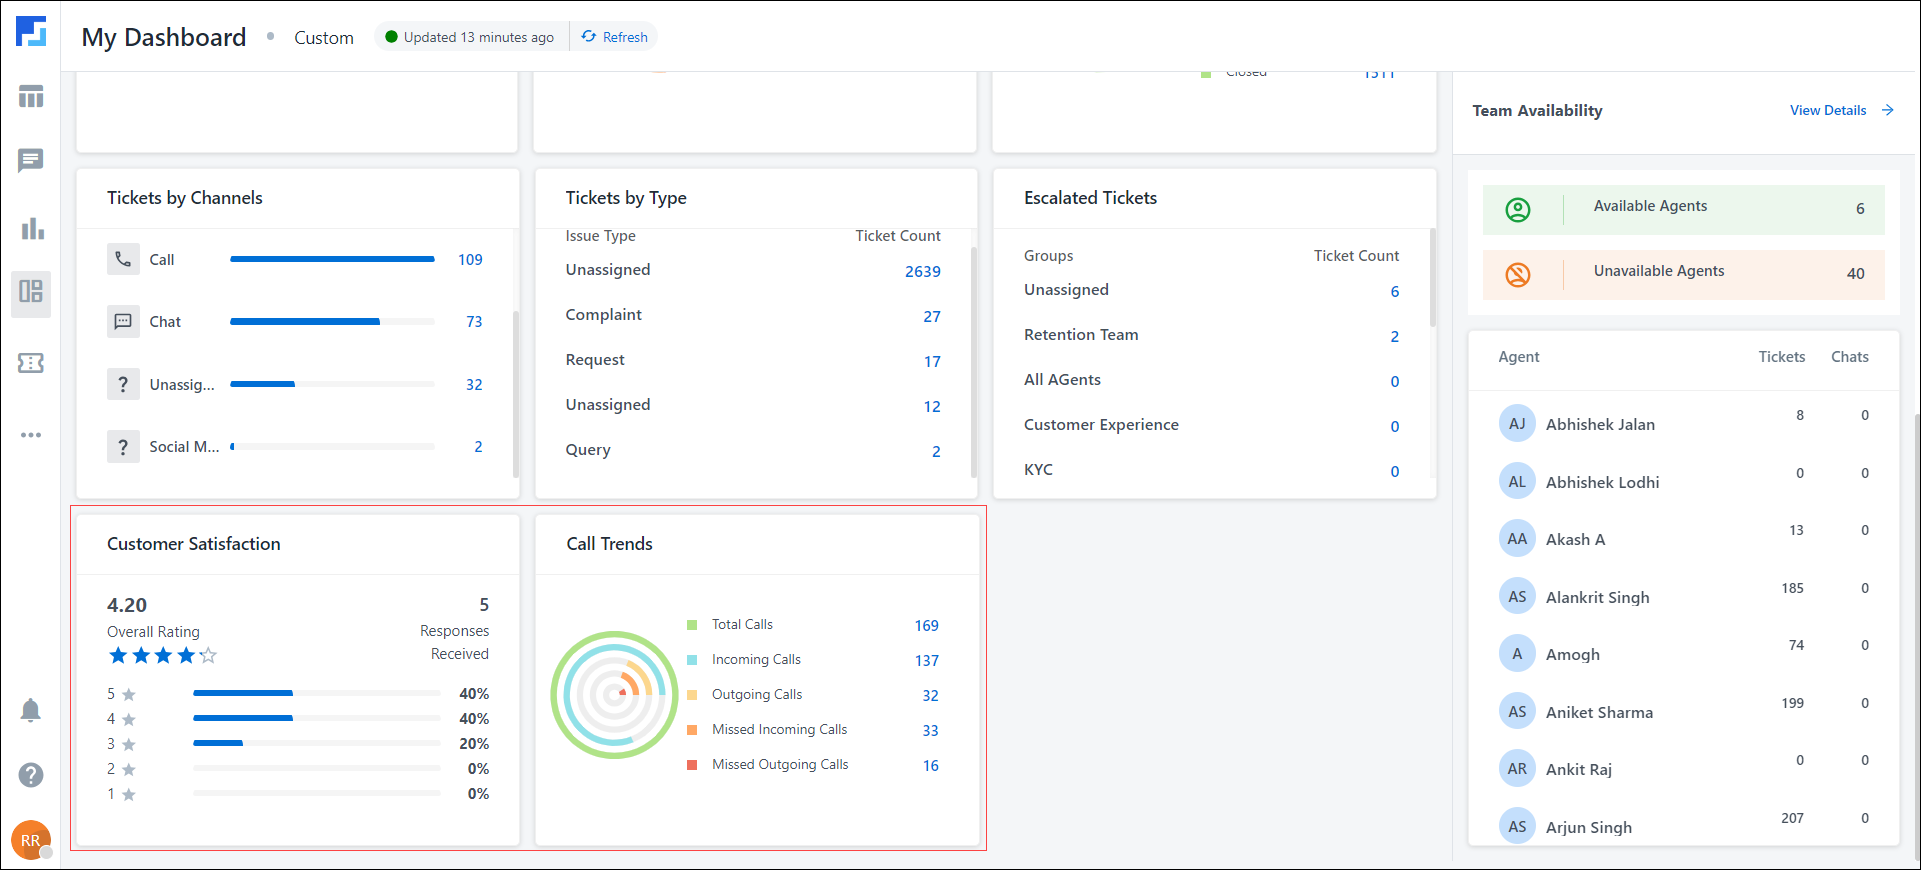
- Tickets by Channel – Displays the count of tickets that match the applied filters, categorized by ticket channels.
- Tickets by Type – Displays the count of tickets that match the applied filters, categorized by the ticket types set up in your account.
- Escalated Tickets – Tickets that have been escalated to a higher level of support due to their complexity.
- Customer Satisfaction – Displays the Customer Satisfaction rating for tickets that match the applied filters.
- Call Trends – Lists the call trends (such as total calls, missed incoming calls, etc.) for tickets that match the applied filters.
- Group and Agent Tickets – This tile displays all tickets categorized by group and agent. The data is automatically rendered as a Group Performance and Agent Performance report. To view these reports, click View Report.
- Most Threaded Tickets – This tile displays tickets that have accumulated more than 5 replies in total, including both agent and customer responses, and that meet the applied filters.
- Chat Metrics – This dashboard displays key performance metrics related to chat interactions, such as the total chats assigned, average first response time, resolution time, chats created by source, unique chats, and more. It helps track chat performance over the selected date range, and provides insights into chat volume and Service Group and agent efficiency. A few key metrics here are –
- Average First Response Time – The average time taken by an agent to respond to a chat after it was assigned to them.
- Average Next Response Time – The average time an agent takes between two responses, excluding the first response message. It calculates the average time for all subsequent messages sent by the agent to the customer.
- For example, if a chat is handed over to an agent at 9:45 AM, and the agent sends their first response at 10:00 AM, the second at 10:10 AM, the third at 10:20 AM, and the fourth at 10:24 AM, the Average Next Response Time will calculate the time between the second, third and fourth response, which is 8 minutes (10+10+4/3). It doesn’t include the first response time, just the average time between subsequent replies.
- Average Assignment Time – The average amount of time a chat remains in the queue before being assigned to an agent.
- Chats vs Tickets Created – This metric shows the difference between Chats Received and Tickets Created, representing the number of customer queries resolved by the Chatbot without requiring manual agent intervention. For instance, if Chats Received is 6 and Tickets Created is 0, it means the Chatbot successfully resolved all 6 customer queries independently.
Any Questions?
Did you find this article helpful? Please let us know any feedback you may have in the comments section below. We’d love to hear from you and help you out!