Tag Archive for: report

How to Create a Custom Dashboard

1. Feature Overview

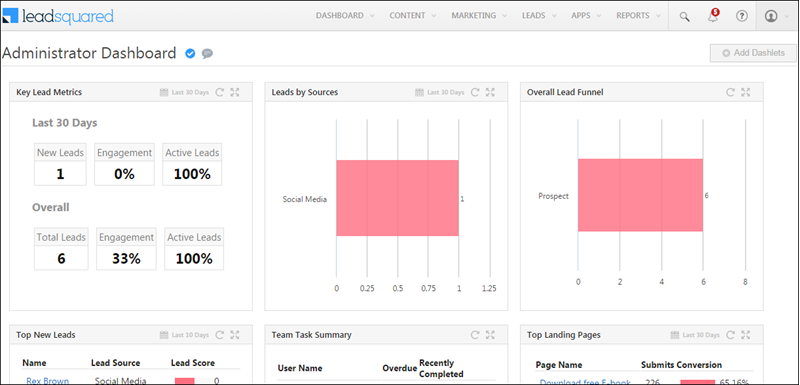
Dashboards present important marketing and sales metrics related to your account.
Your dashboard is the first page you see when you log in to your LeadSquared account. Each dashboard is customizable and comprises –

  • A number of dashlets (default and custom) or,
  • A custom report (configured using an external URL)

All users can create dashboards, while Admins can also share the dashboards they create with other teams.
LeadSquared Custom Dashboards

Note: To gain analytics and insights into your entire sales pipeline, learn about SIERA’s Sales User Dashboard.


2. Create Your Own Dashboard

All users can create their own dashboards –

  1. On the main menu, click Dashboard>Create New Dashboard
  2. Name your dashboard, then click Create

Dashboards you create will be displayed under the My Dashboards sections –
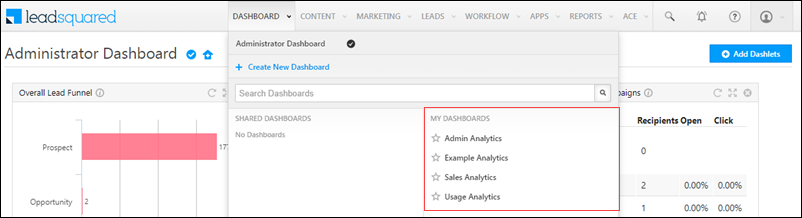
LeadSquared Dashboards

2.1 Add Dashlets

  1. Click the Add Dashlets button
    • Use the Select Category drop-down to filter dashlets by category or just scroll down and select the dashlets you want. Click Add when you’re done
    • To build custom lead distribution dashlets, click the Dashlet Builder button (for more information, see Custom Dashlet Builder App). If you want to display your own dashlets or reports, see the ‘Add Your Own Report’ section below.
  2. Each dashlet has options for time frame customization, refresh, expand and delete.
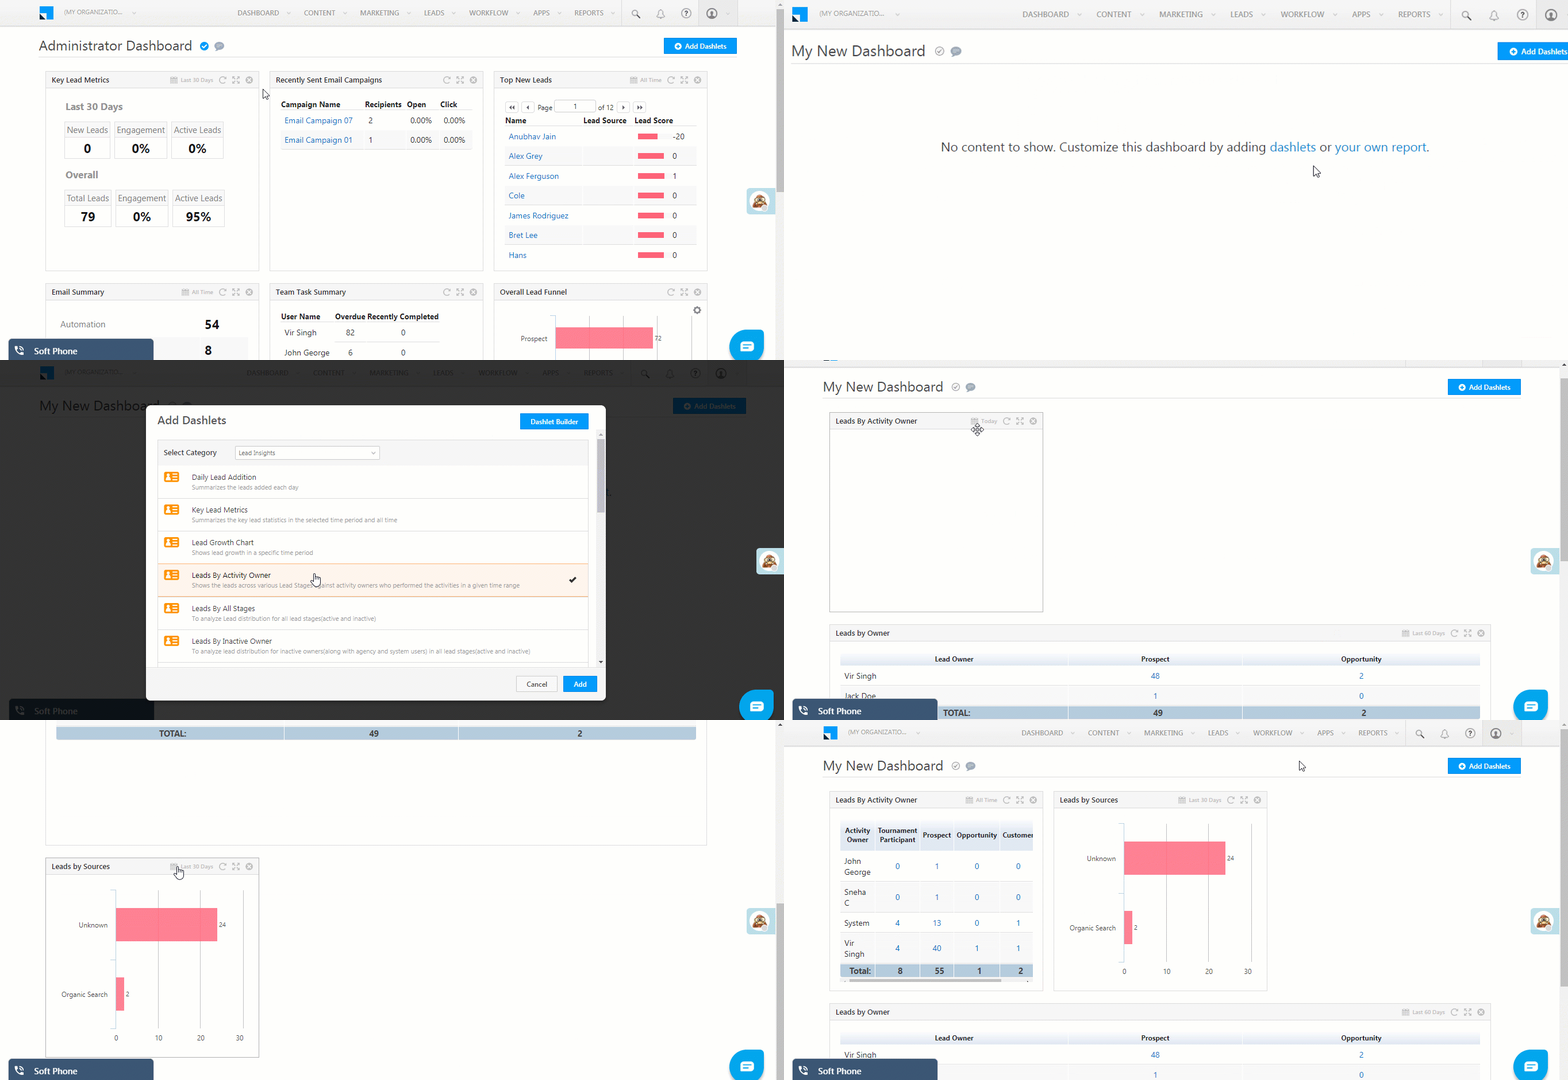
LeadSquared Custom Dashboards


2.2 Organize and Align Dashlets

You can drag and drop dashlets to rearrange them.
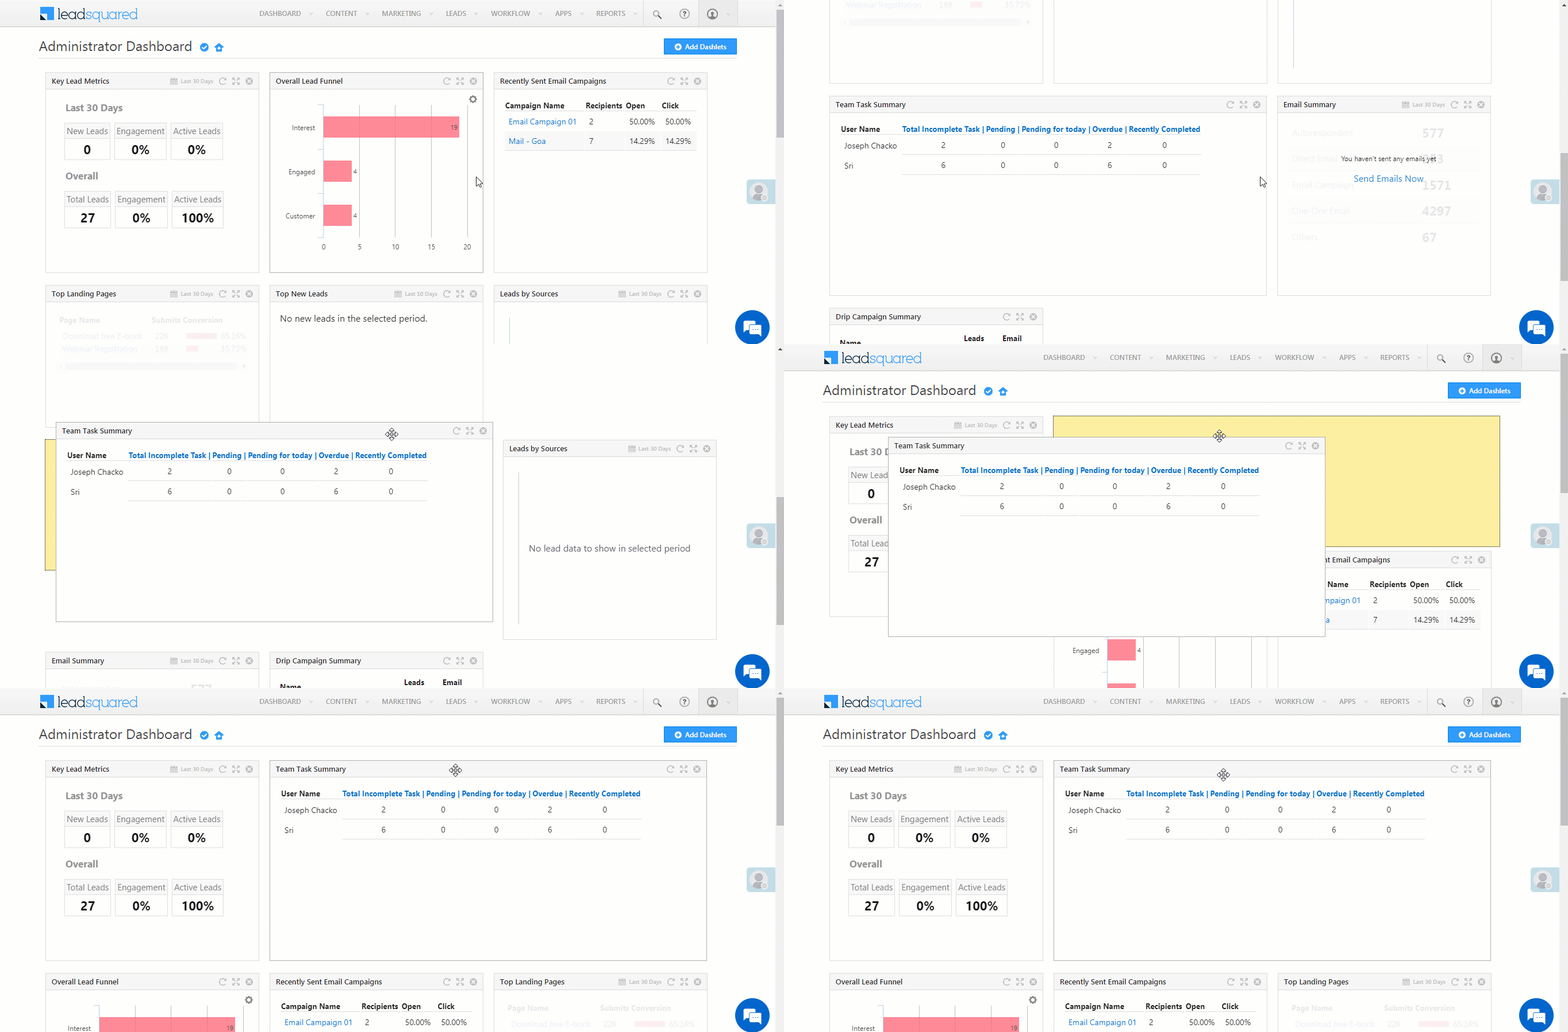
LeadSquared Dashlet

Note: Different dashlets have different default dimensions. You cannot resize dashlets.


3. Add Your Own Report

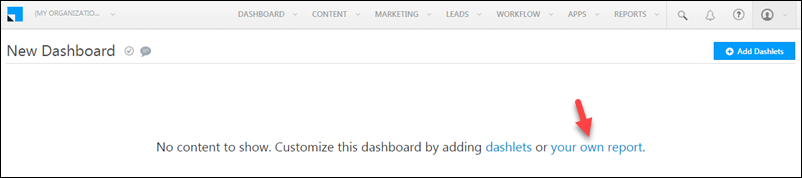
Here’s an example of an external report displayed on your LeadSquared dashboard –
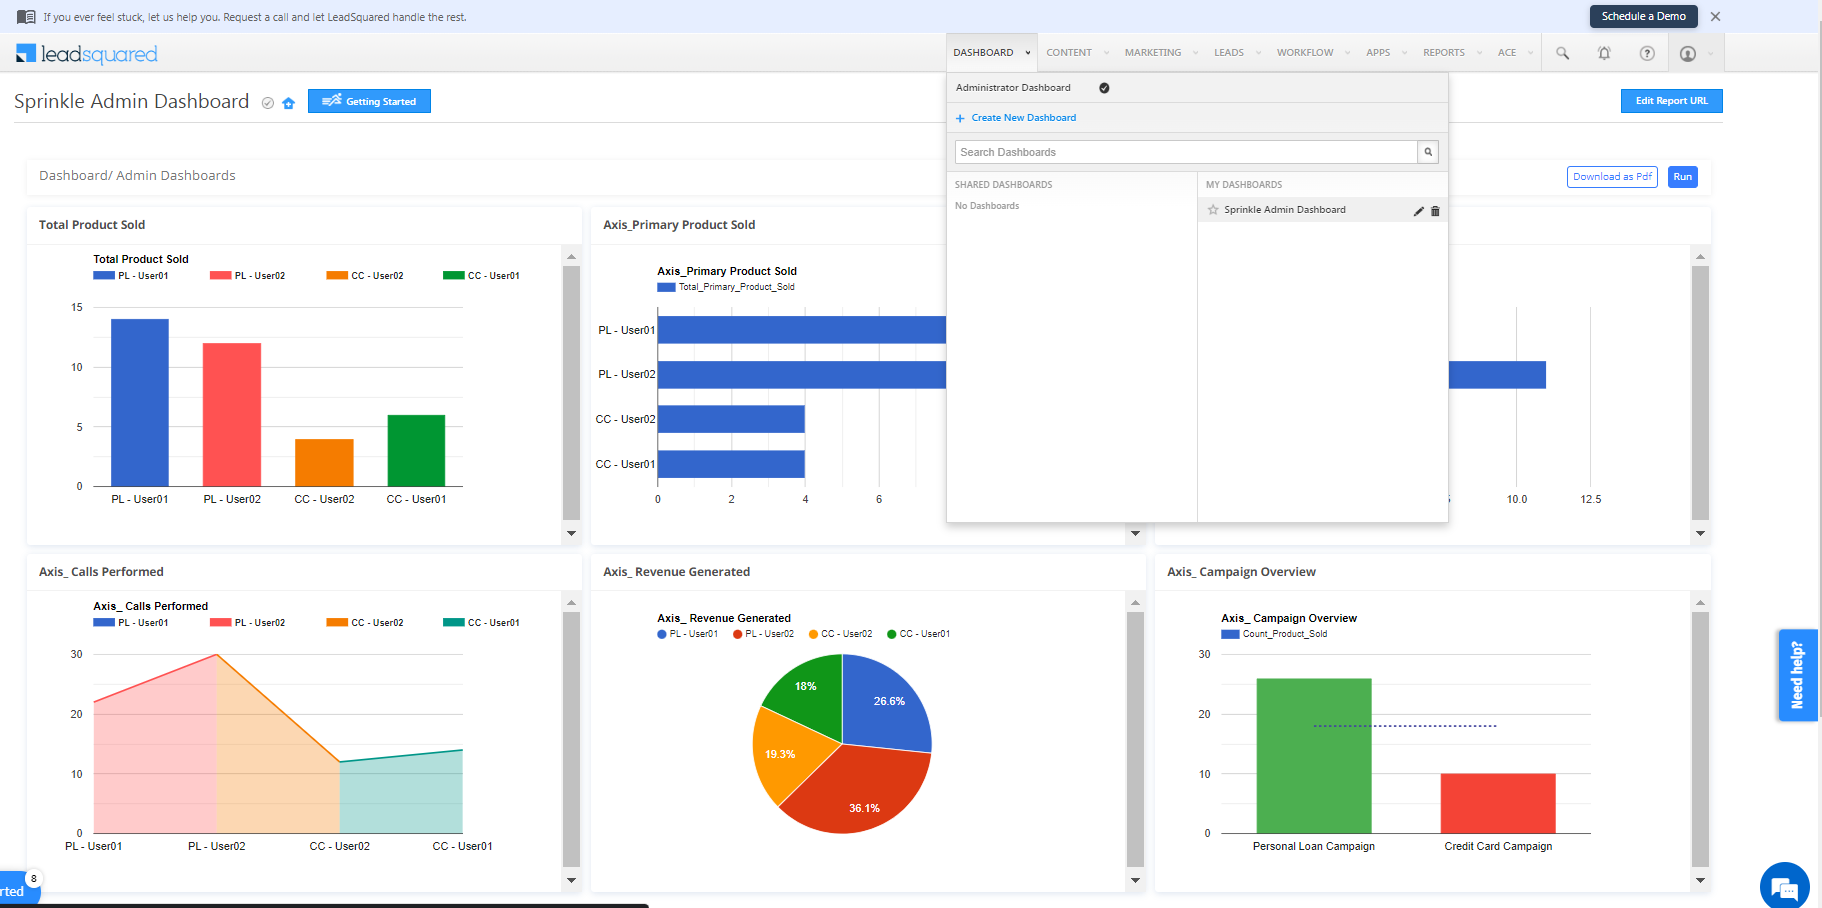
LeadSquared Custom Report

Click the your own report link.

LeadSquared Custom Dashboards

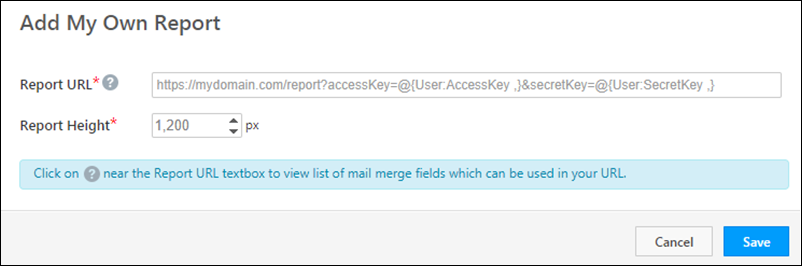
Enter the following details in the pop-up and click Save when you’re done. –

  • Report URL – The URL where your report will be retrieved from.
  • Report Height – Lets you configure the display size of the report.

Note: You can even add the SIERA Dashboard to Your LeadSquared Dashboard  –

  1. Navigate to Reports>SIERA>Dashboards>All Dashboards.
  2. Click on the siera sales dashboard copy link icon icon againt the SIERA Dashboard and click Copy Embed URL.
  3. Paste the link in the Report URL field.
LeadSquared Custom Dashboards


4. Mark a Dashboard as Default

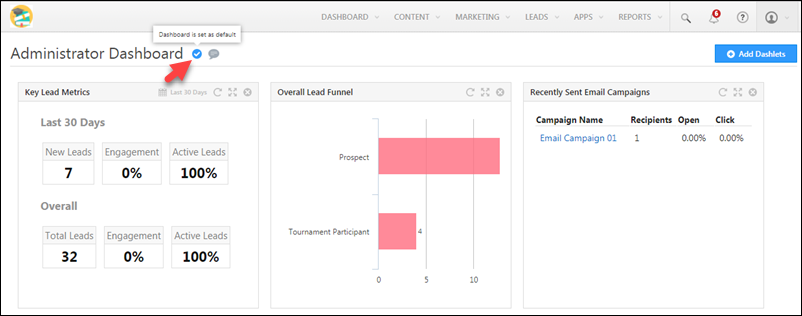
Click the following icon to set a dashboard as default –
LeadSquared Custom Dashboards


Any Questions?

If you have questions, let us know in the comments section. We’ll get back to you as soon as we can.
How to read Lead Distribution Analysis (3 dimensional)

LeadSquared provides powerful analytics around marketing and sales to help you fine-tune your business processes. Now we have added one more report to make you understand how Lead Distribution happens in your account.

This report is accessible  Reports -> Lead Insights -> Lead Distribution Analysis – 3 fields .

This report works on based on 3 fields as explained below

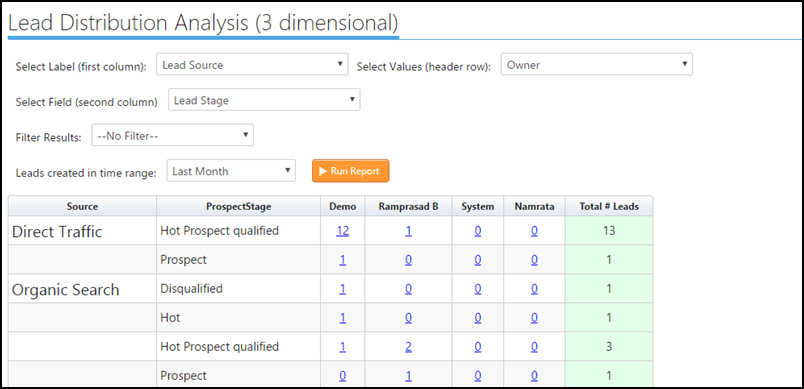
3 dimension report

Select Label (First Column ) – The Lead field which you select will be displayed in the first column of the report, in the above image, I have selected Lead Source.

Select Values (header row) – The Lead field selected will be displayed as a row header of the report, the data will be split based on the field which you have selected in this section. In the above image, I have selected Lead Owner field.

Select Field (Second Column) – The Lead filed selected here will be used to further classify the number of leads . Example : in the above image I have chosen Source as 1st column and Lead Stage in the second column, where the report now gives you a report In Lead Source for a particular Lead Stage how many leads have been distributed for the Owners.

Filters  Can be used if you wish to filter the data on specific criteria.

Lead Created in time Range -Used to filter the leads based on their created dates.  In the above image, I have selected last month, so the report will show the lead distribution for only those leads which were created last month.

Hope this report solves your Lead Distribution question.

How can I use the Email Campaign report?

1. Feature Overview

The Email Campaign Report provides various metrics (like the percentage of leads who have clicked, opened, or unsubscribed from the email) that help you study the impact of the campaign on your leads. You can also export these leads and create a list with those who have clicked on a link, unsubscribed, marked the email as spam etc. Modified and targeted email campaigns can be sent to the leads in these lists accordingly.

Note: To know how to create an email campaign, see Create and Schedule Email Campaigns.


2. Prerequisites

  • You must be an Admin or Marketing user to view the report.
  • You must first create and send an email campaign.


3. Email Campaign Report

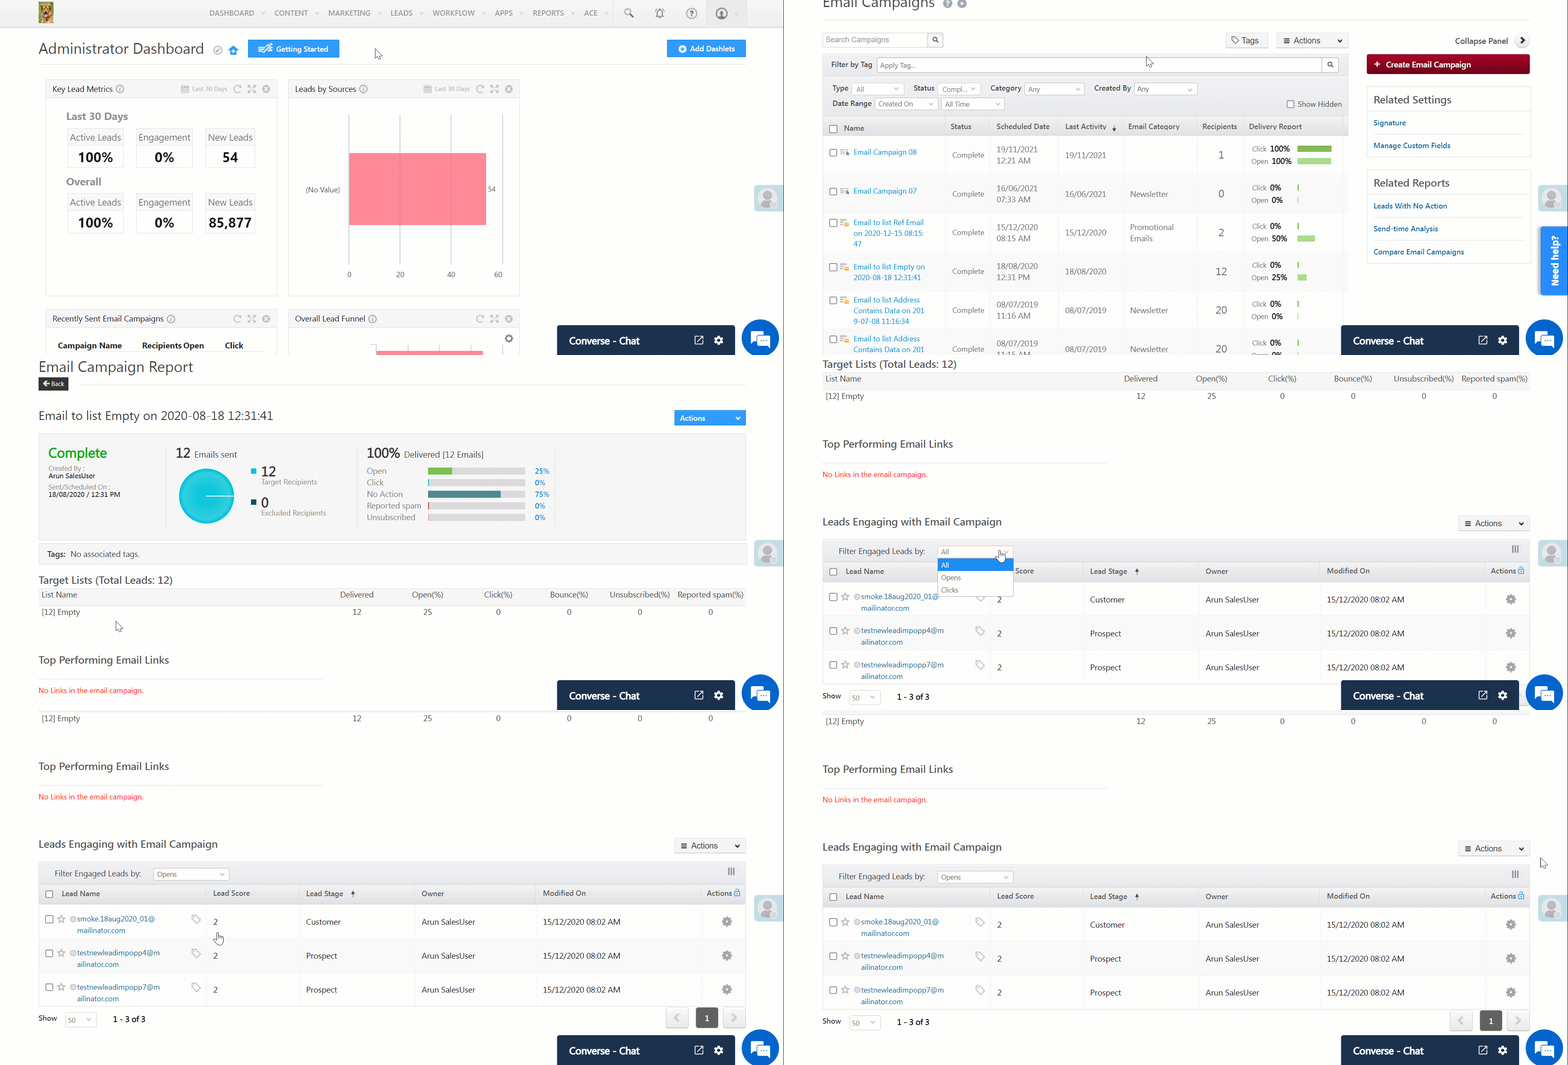
Navigate to Marketing>Email Campaign and click on the relevant email campaign.

  • On the top of the page, you can view the status of the email campaign, number of recipients (target and excluded), and the email delivery rate.
  • You can also view the percentage of leads that have
    • Opened the email.
    • Clicked a link in the email.
    • Not responded to the email.
    • Marked the email as spam.
    • Unsubscribed from receiving further emails.
  • Under Target Lists, you can view the lists of leads you’ve sent emails to and their response (i.e., the click rate, bounce rate, spam rate, etc.). If a particular list has a low click rate, you can make changes to the email campaign based on the interests/requirements of the leads in that list.
  • Under Top Performing Email Links, you can view the different links in the email and their click numbers. If you observe that any of your links has low clicks, you can change the position of the link or replace the link with a new one.
  • Under Leads Engaging with Email Campaign, you can filter the leads based on whether they opened the email or clicked on the attached link. To do so, click the dropdown next to Filter Engaged Leads by.
  •  You can view the leads who unsubscribed from the email,  the leads from whom the email bounced and leads who have marked your email campaign as spam. These leads will automatically be added to the Do Not Email list in your account. If you want to send a follow-up email to these leads, you have to manually edit the lead details and un-check their Do Not Email field.
  • To export the leads in a list, click and select Export Leads.
Note: To view the reports of emails sent through automation, see Automation Reports.

LeadSquared - Email Campaign Report


4. Other Actions

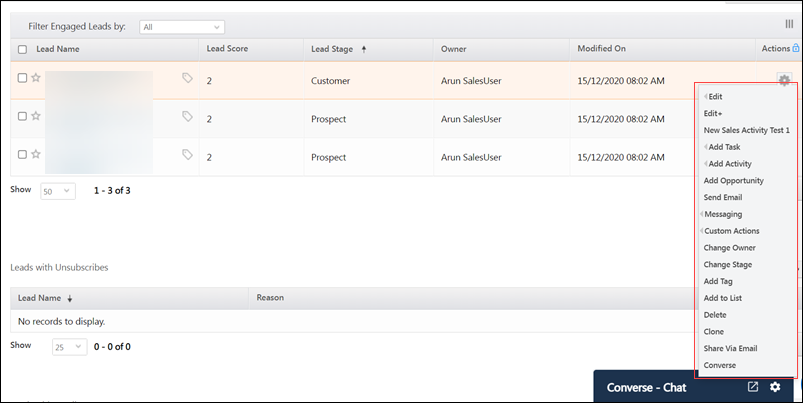
To perform the actions shown in the gif, alongside the leads present in the list, click LeadSquared.

LeadSquared - Other Actions in Email Campaign Report


5. FAQs

How is the Click and Open Count Calculated in the Email Campaign Report?

  • Issue: There are discrepancies in the data count representation. Specifically, the No. of Opens appear differently in the summary section (chart) and the lead-wise grid (the count is lower here).
  • Resolution: 
    • Summary Section (Chart): The summary section shows the count of all activities for the lead but only takes the first activity instance for the activity type (Open/Click/Unsubscribe/Bounce/Spam).
    • Lead-Wise Section (Grid): In the grids (‘Lead Engaging with Email Campaign’, ‘Lead with Unsubscribes’), the record for a lead is removed when the activity moves from one stage to another (for instance, from Open → Click).
    • Advanced Search: To get the count of leads for each activity, you can use Advanced Search and search for the lead for each activity type (Open, Click, Unsubscribe). Here, the same lead will appear under all activity types.
  • Example:
    • Step 01 – Lead A opens the campaign:
      • Open count in summary = 1
      • Click count in summary = 0
      • Open count in grid = 1
      • Click count in grid = 0
    • Step 02 – Lead A clicks on the “View in Browser” link:
      • Open count in summary = 1
      • Click count in summary = 1
      • Open count in grid = 0
      • Click count in grid = 1
    • Step 03 – Lead A unsubscribes from the campaign:
      • Open count in summary = 1
      • Click count in summary = 1
      • Unsubscribe count in summary = 1
      • Open count in grid = 0
      • Click count in grid = 0
      • Unsubscribe count in grid = 1

Why do email unsubscriptions or unusual link clicks appear frequently in reports?
This may be caused by aggressive spam filters in email servers. When an email is received, the server may “click” links to scan for suspicious content before delivering it to the inbox, spam folder, or quarantine.


Any Questions?

We’d love to answer your questions or hear your own unique use cases. Feel free to share your experiences in the comments section below.