


Get Started

Sales Suite
Field Ops
Marketing
Service CRM
Integrations & Apps
FloStack
Analytics with Lumen

1. Feature Overview
Lumen answers analytical questions about your CRM data in plain conversation. Instead of building a report, selecting metrics, and configuring filters, you describe what you want to know. Lumen identifies the data it needs, queries your account, and returns a chart or a table along with a written summary of what the data shows.
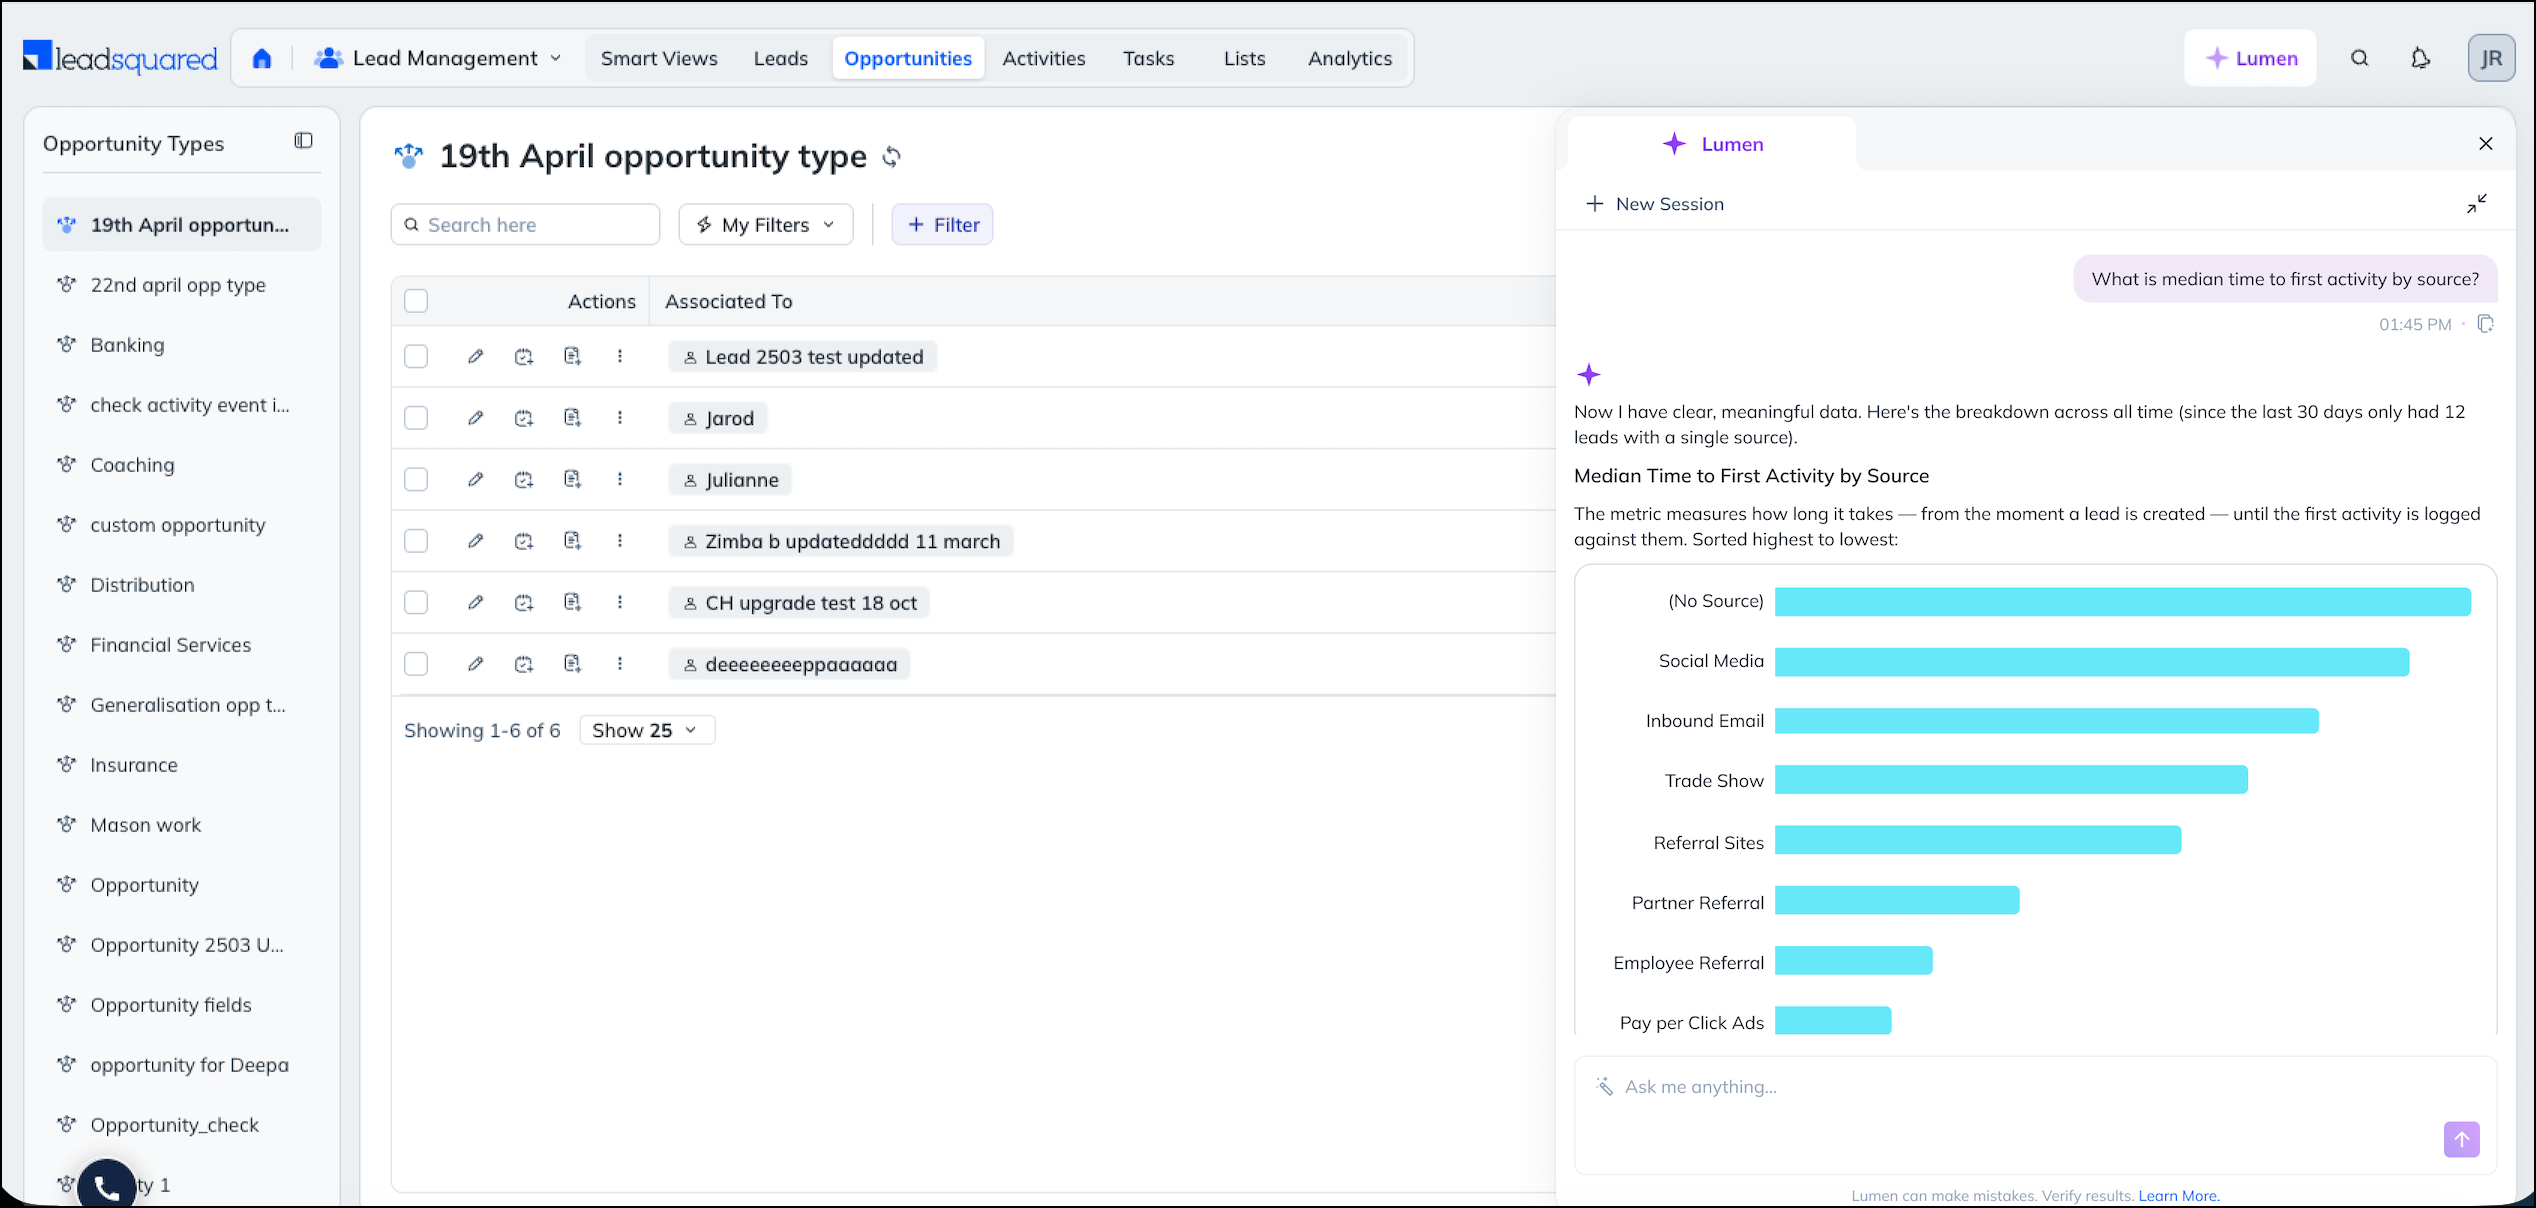
For example, enter What is median time to first activity by source? Lumen returns a median time to first activity by lead source, across all leads with a recorded first activity.
2. Prerequisites
- You have access to a LeadSquared account where Lumen is enabled. To enable it on your account, contact support@leadsquared.com.
- You are signed in to LeadSquared. Lumen uses your session to authenticate its queries.
- Your account holds data for the modules you want to analyse. Lumen reports on the data present in your account. It cannot calculate a metric from a field your team does not populate.
3. How It Works
When you enter a prompt, Lumen carries out the following sequence:
- Classifies the prompt to determine whether it is an analytics question, a sales execution action, or a product question.
- Identifies the data points needed to answer the question, and the sources they come from.
- Builds a query and runs it against your account data.
- Generates the response, which includes the chart or table you asked for and the insights.
3.1. Common Use Cases
The following questions are the ones sales teams ask most often. Each one is time-consuming to build as a conventional report, because it draws on multiple data sources and calculated metrics.
| Use Case | Example Prompt | What Lumen Returns |
| Lead source performance | Show me win rate and sales cycle by source | Conversion or win rate for each lead source, with the volume behind each figure. |
| Sales rep productivity | Show me the best reps by tasks completed | A ranked view of user performance against the measure you specify. |
| Speed to engage and convert | What is the average time to first attempt by team? | Elapsed time between lead creation and first contact, or between creation and conversion. |
4. Ask an Analytics Question
To ask an analytics question:
- Sign in to LeadSquared.
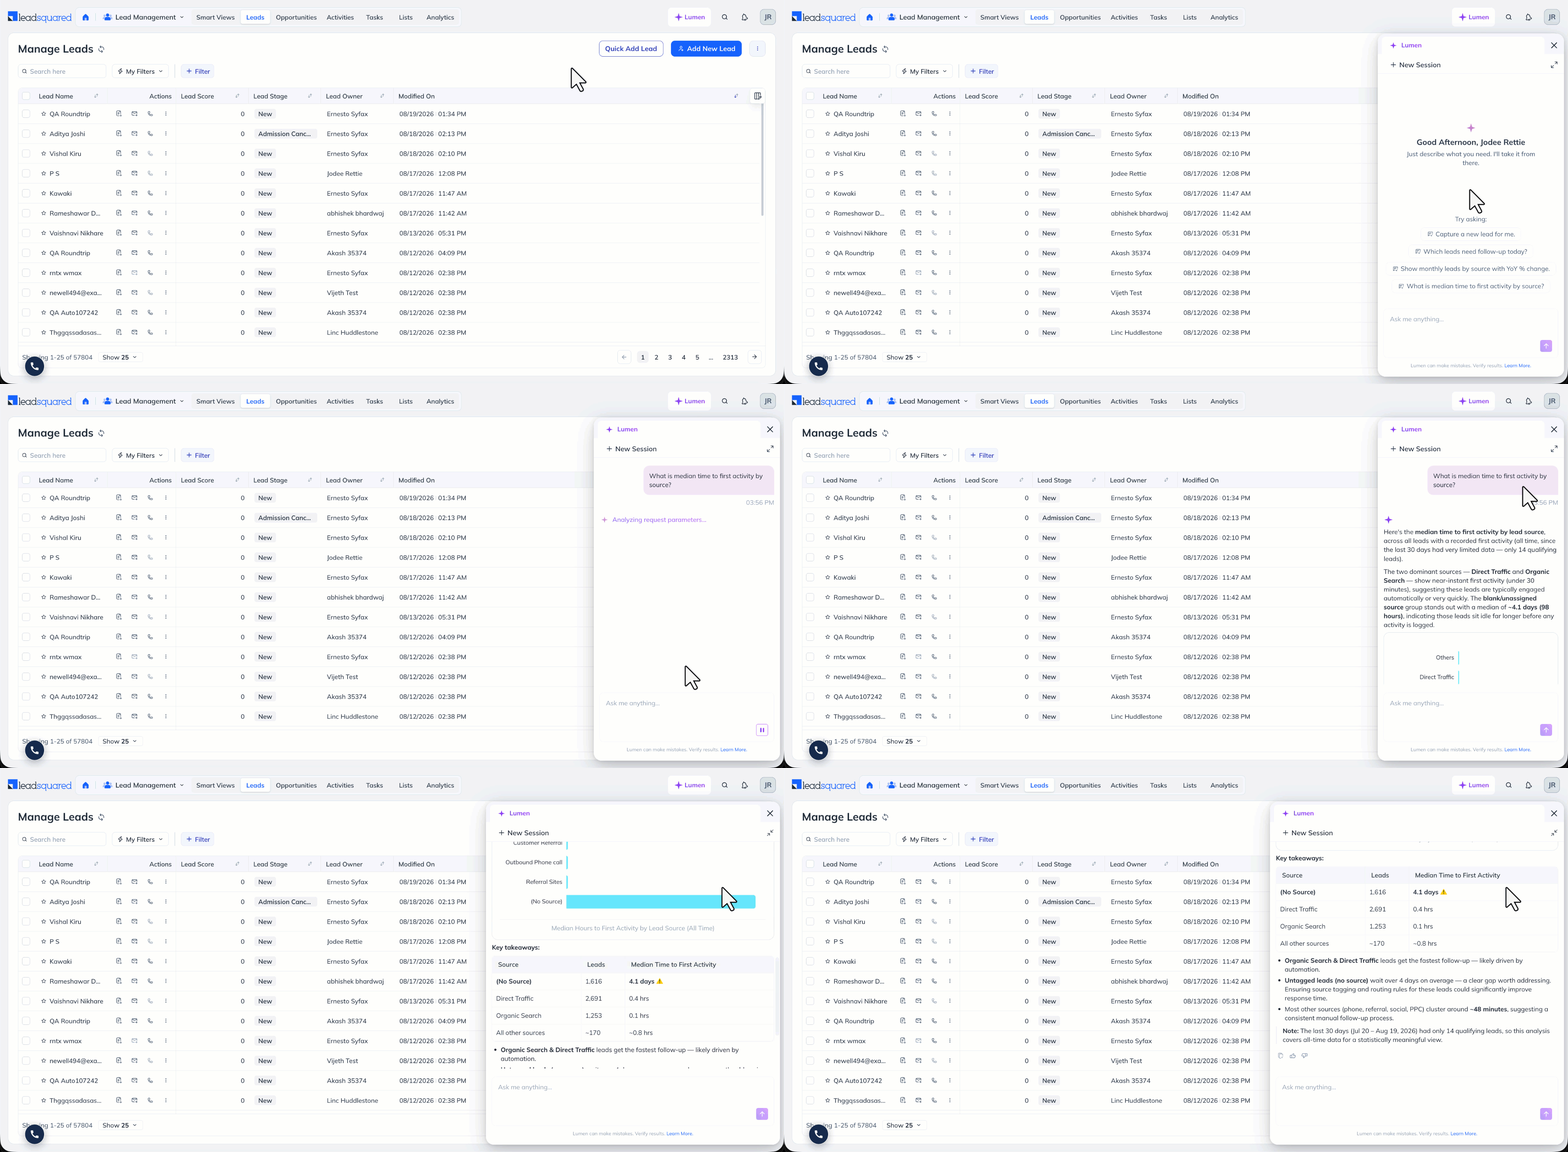
- On any page, click the Lumen button in the top navigation bar. The Lumen panel opens on the right side of the screen.
- Use one of the suggested prompts, or enter your query in the Ask me anything box.
- Review the response in the panel.
The suggestions under the Try asking section change according to the page you are on. On the Leads page, for example, Lumen suggests opportunity questions such as Show monthly leads by source with YoY % change, and What is median time to first activity by source? Move to a different page to see suggestions relevant to that module.
5. Understand an Analytics Response
An analytics response is made up of several parts. Lumen tells you what data it used and how it treated that data before it presents the result.
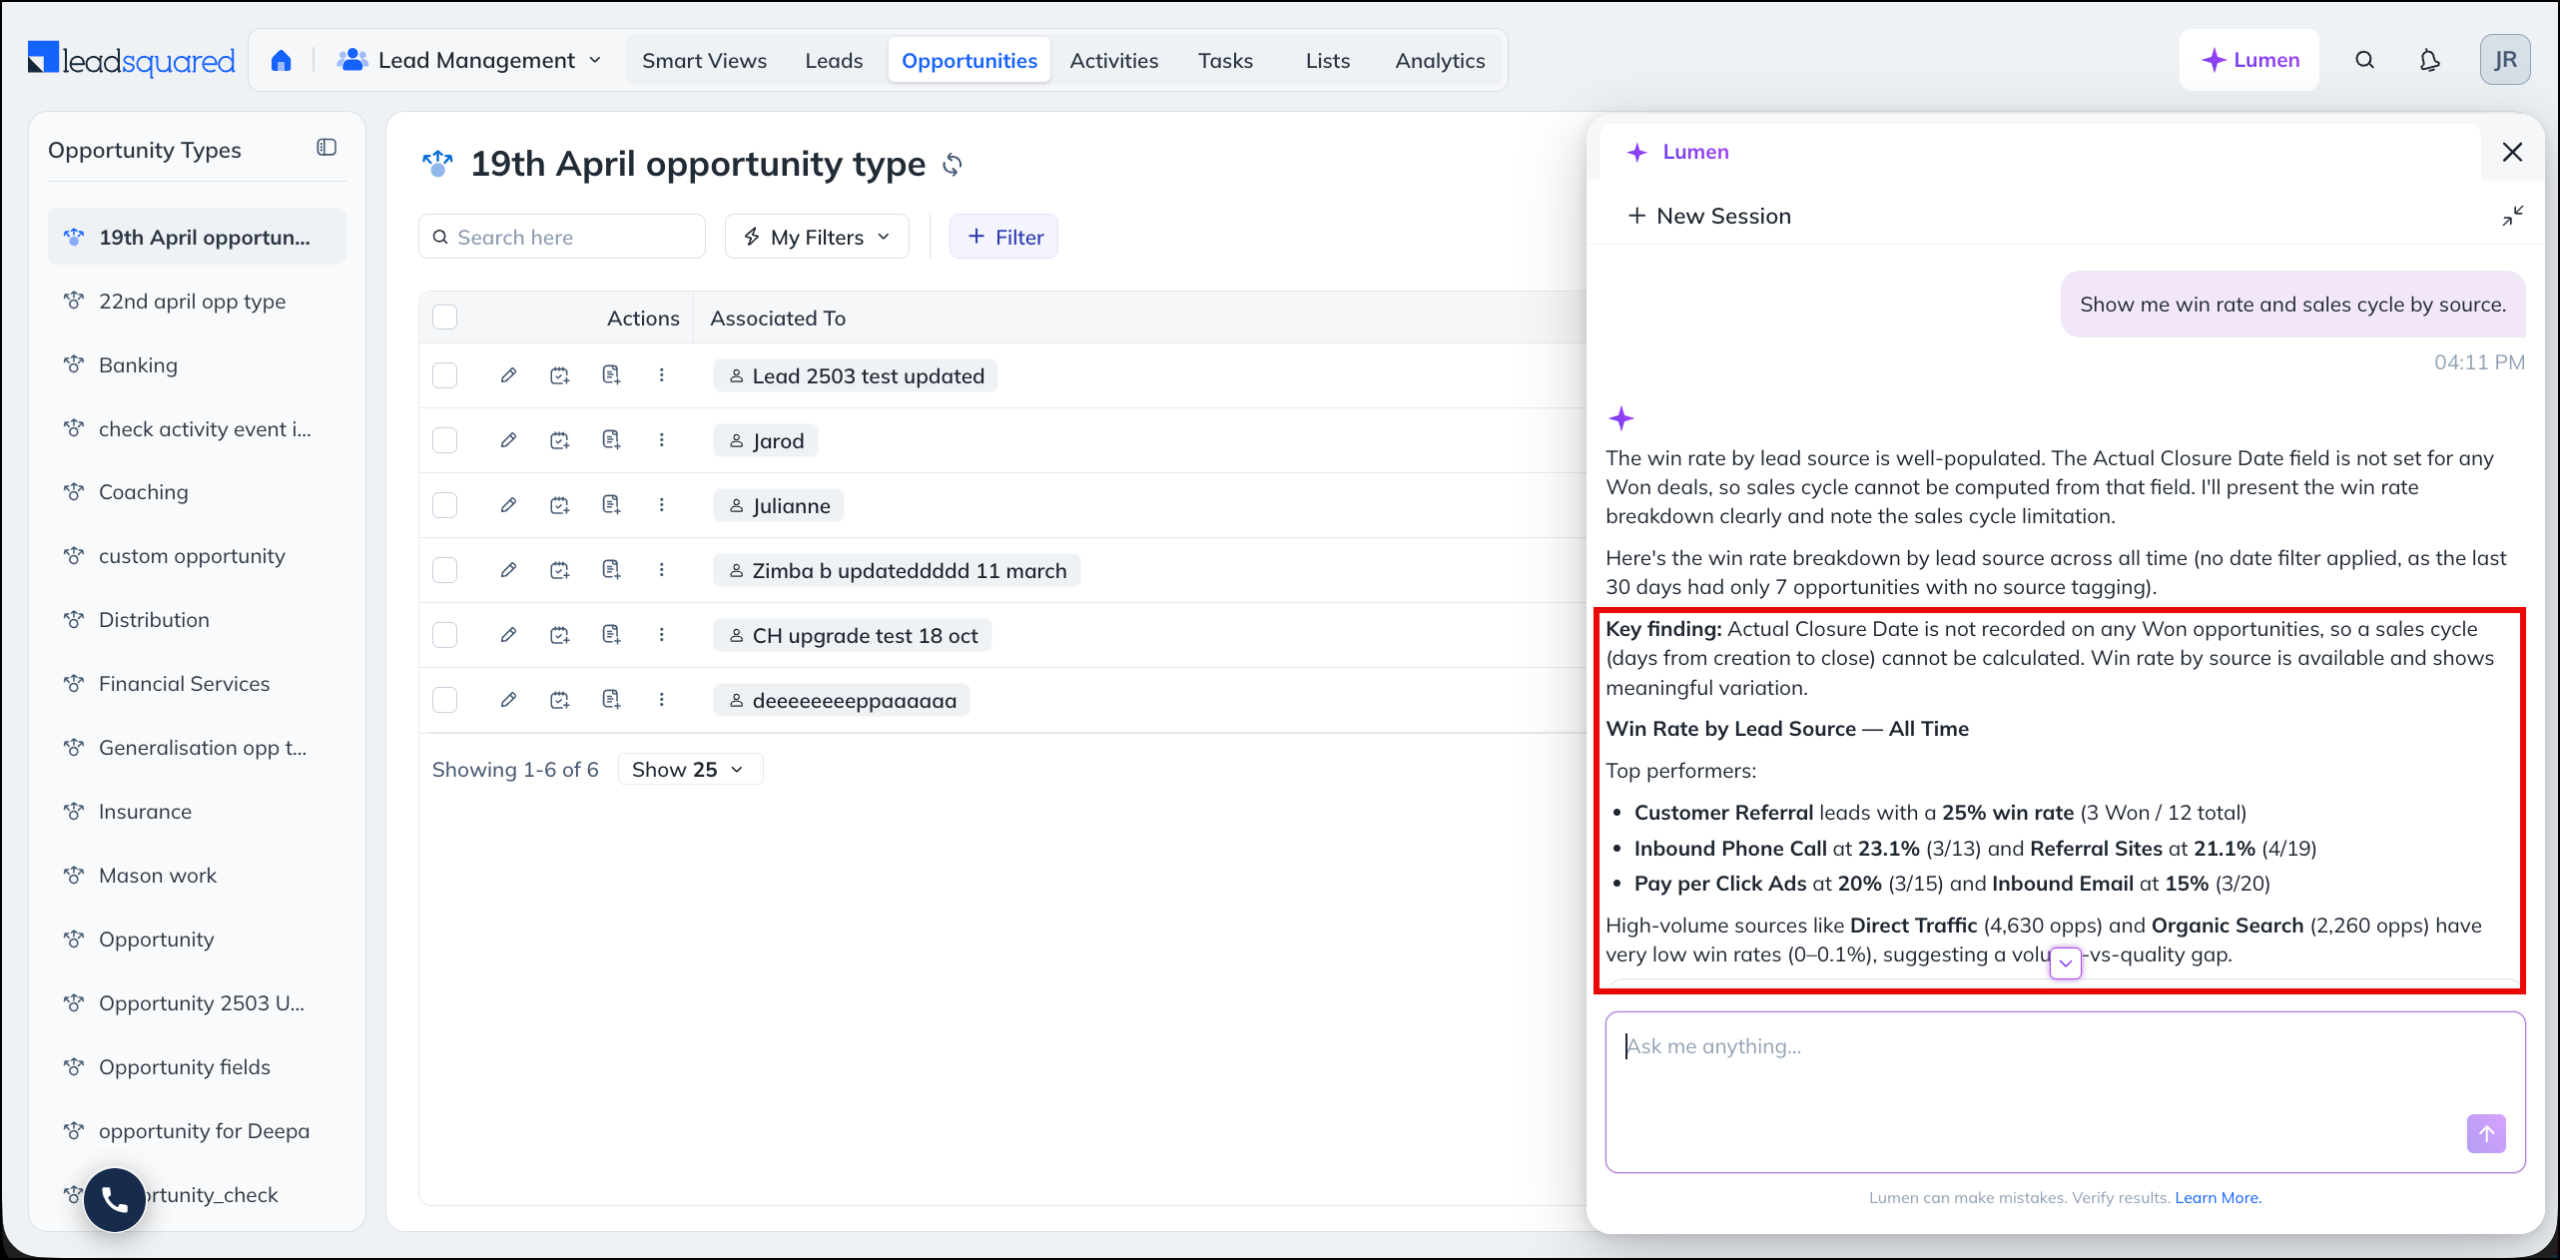
For example, let’s ask a question on Opportunities: Show me win rate and sales cycle by source.
5.1 Notes on the Data
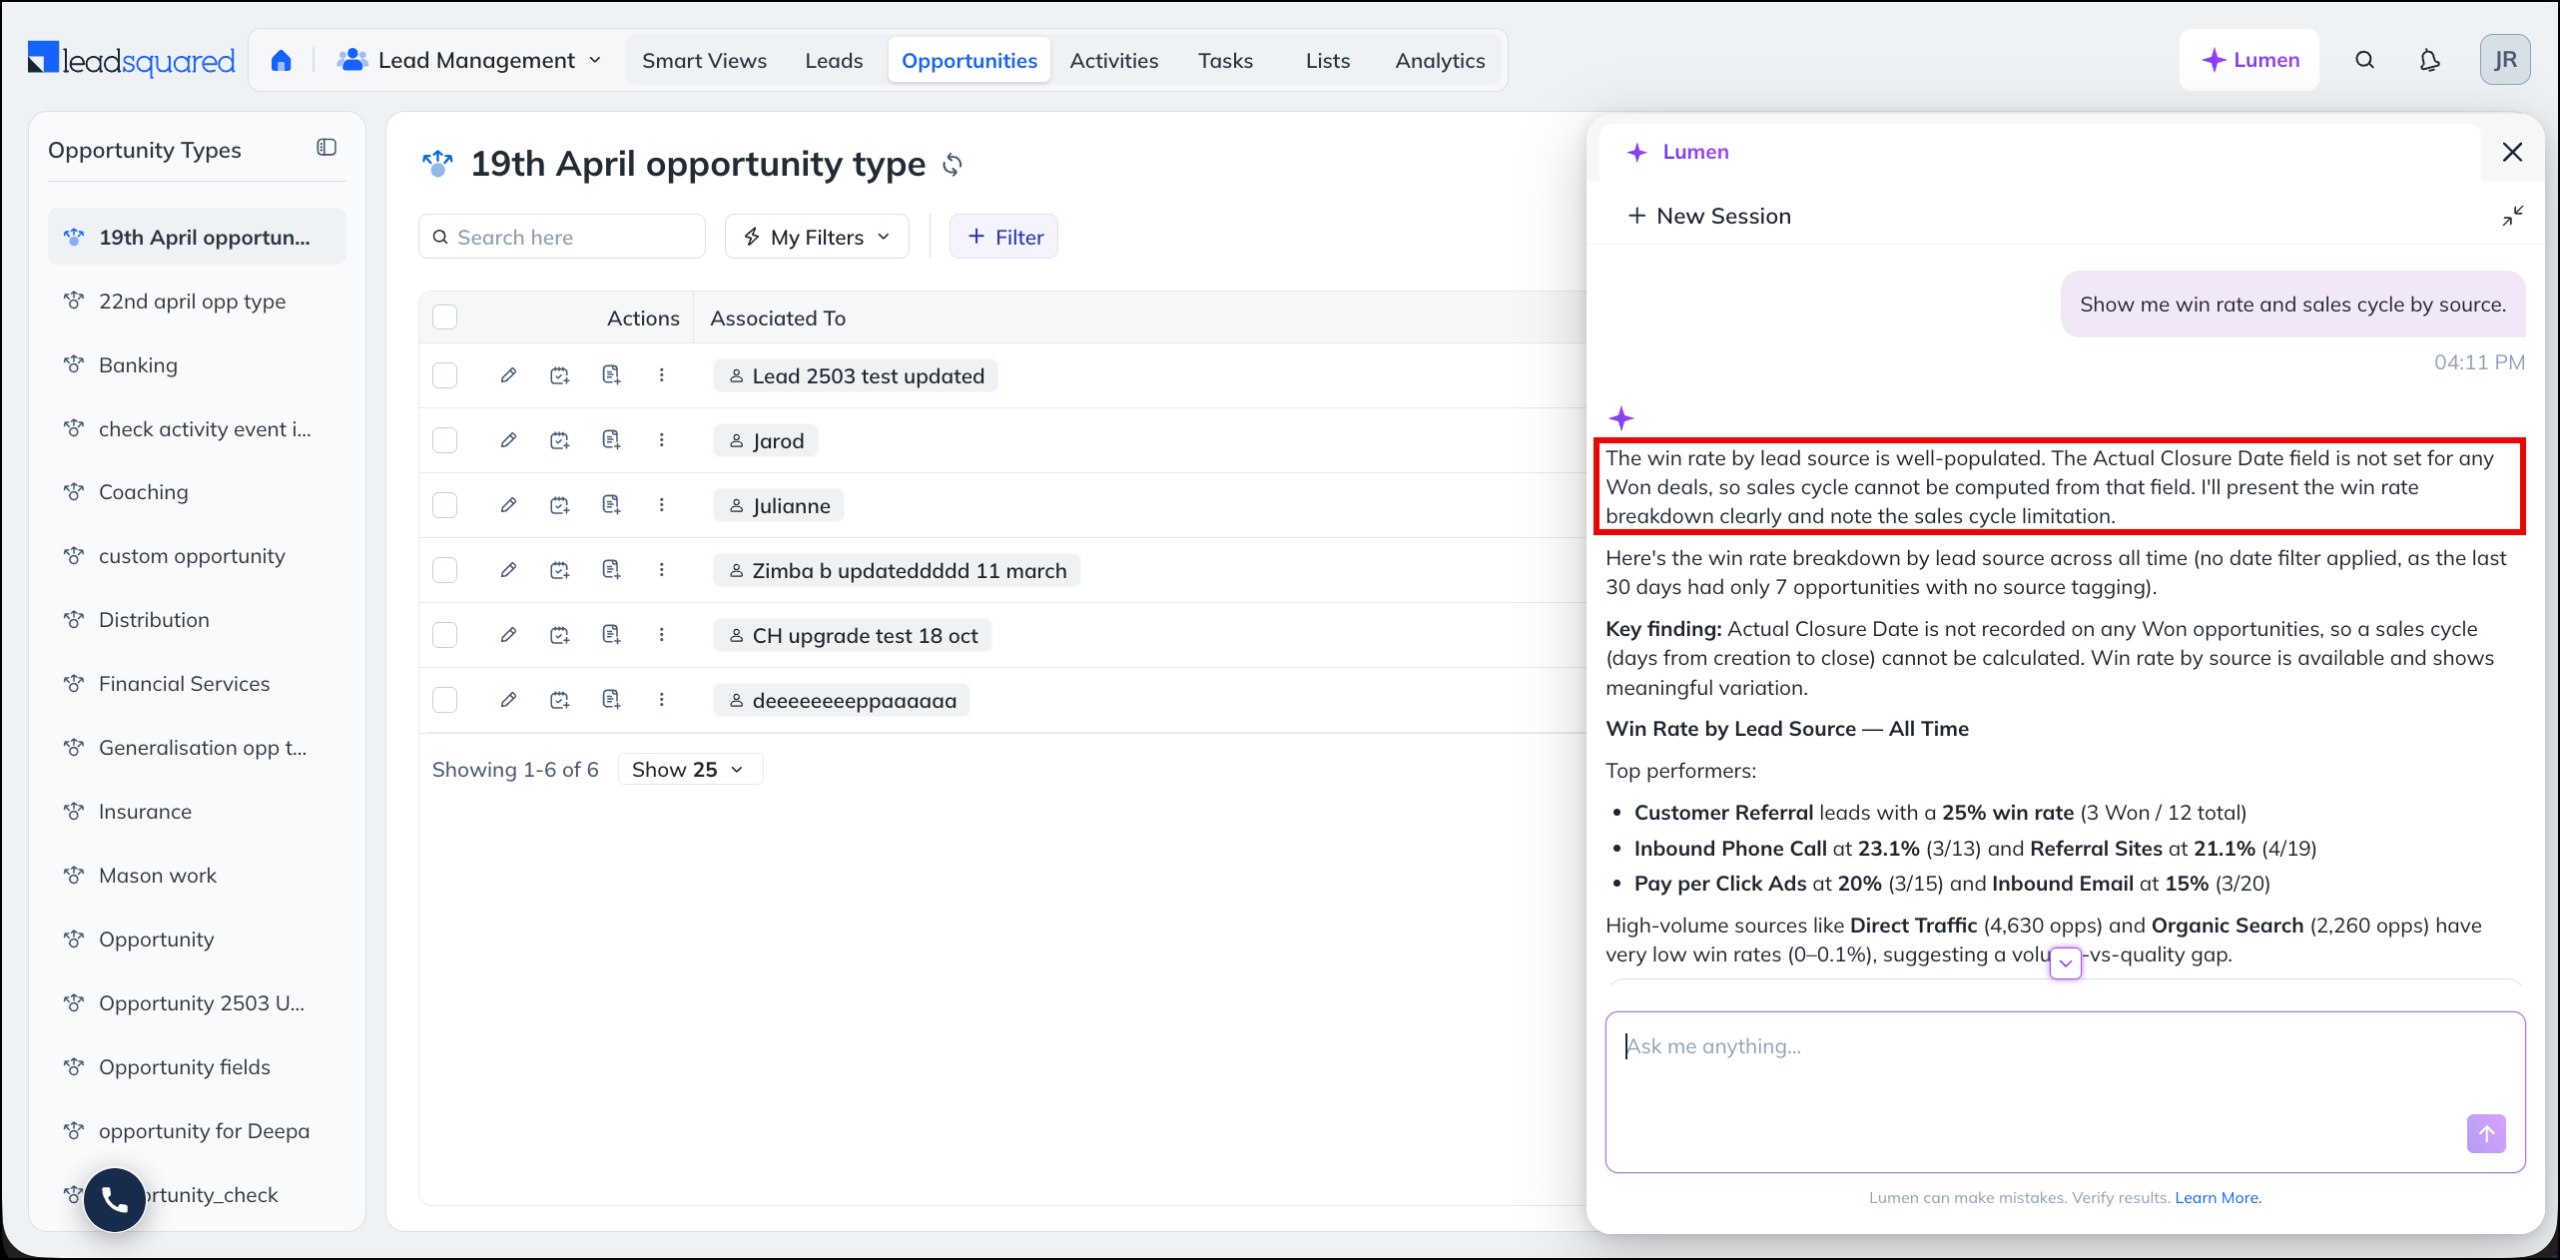
Lumen lists anything that affects how you should read the result. This includes metrics it could not calculate, along with the reason.
In the example below, Lumen could not calculate sales cycle days because the Actual Closure Date field is not populated on closed opportunities in that account. Lumen still answers the win rate half of the question, and explains why the sales cycle half is unavailable.
5.2 Data Scope
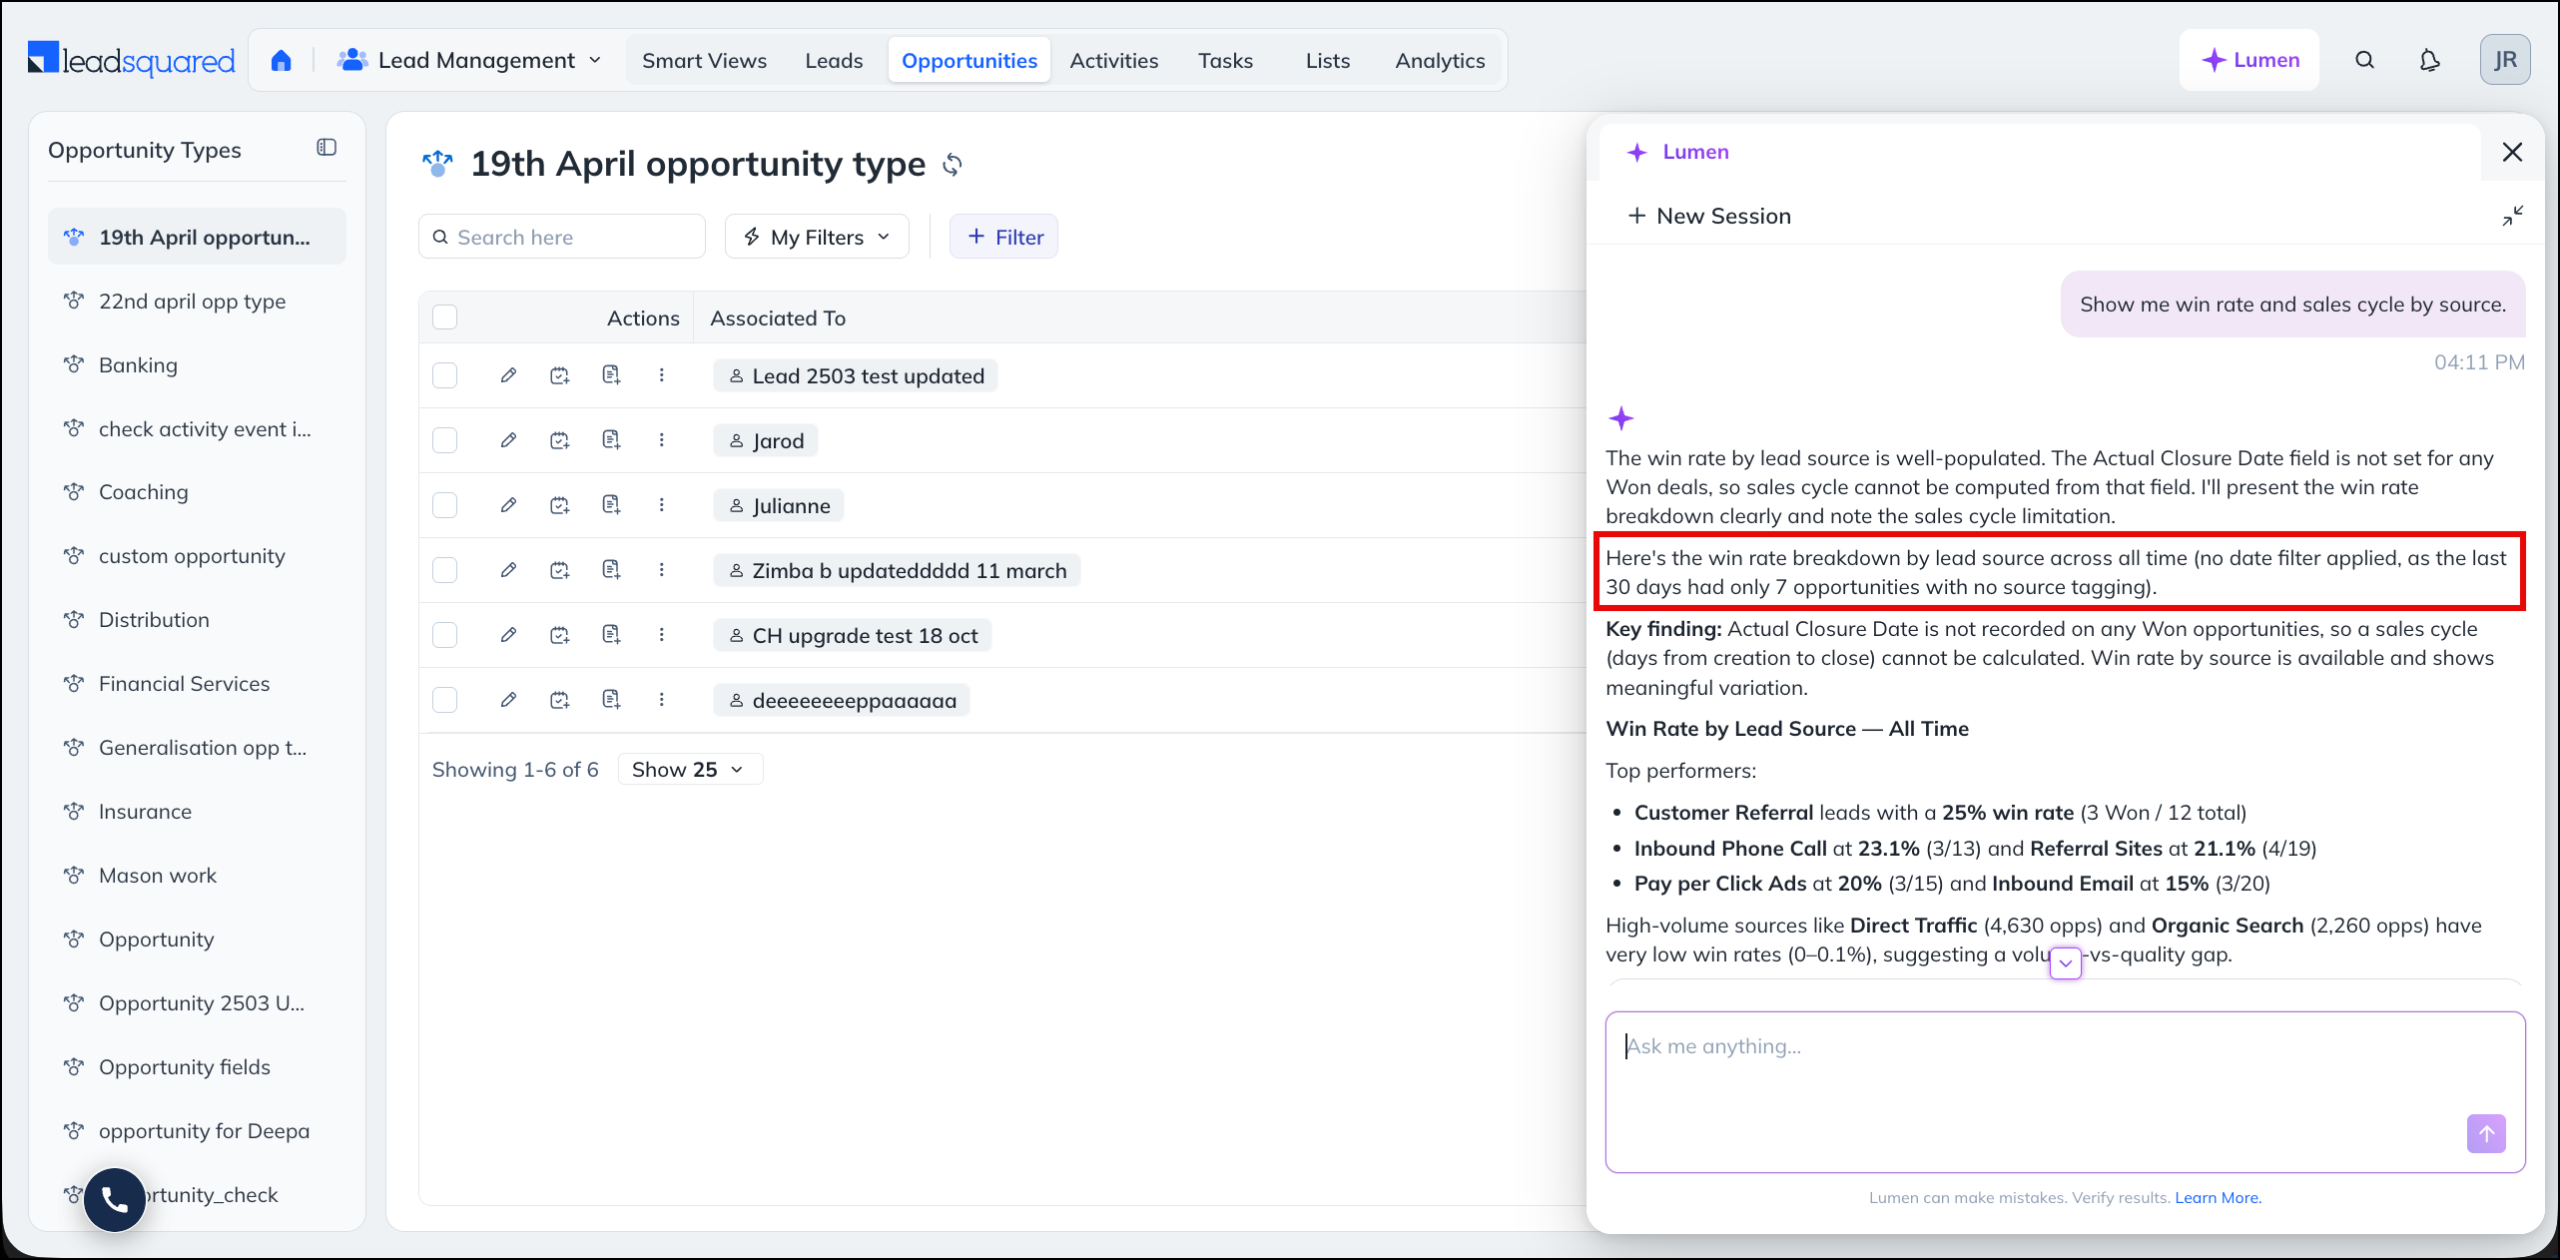
If your question specifies a period that holds no data, Lumen tells you so and widens the range automatically rather than returning an empty result. For example, when an account has no opportunity data for the last 30 days, Lumen reports that gap and returns the all-time view instead, stating clearly that no date filter was applied.
5.3 Key Highlights
Under the Key highlights section, Lumen summarises the most significant patterns in the result. The summary draws on all the data Lumen considered, not only the metric you asked for.
For example, if you ask only for win rate, Lumen may also reference opportunity volume, because volume is the denominator behind the win rate calculation. This surfaces patterns that the chart alone does not show, such as a high-volume lead source that converts at close to zero percent.
5.4 Chart or Table
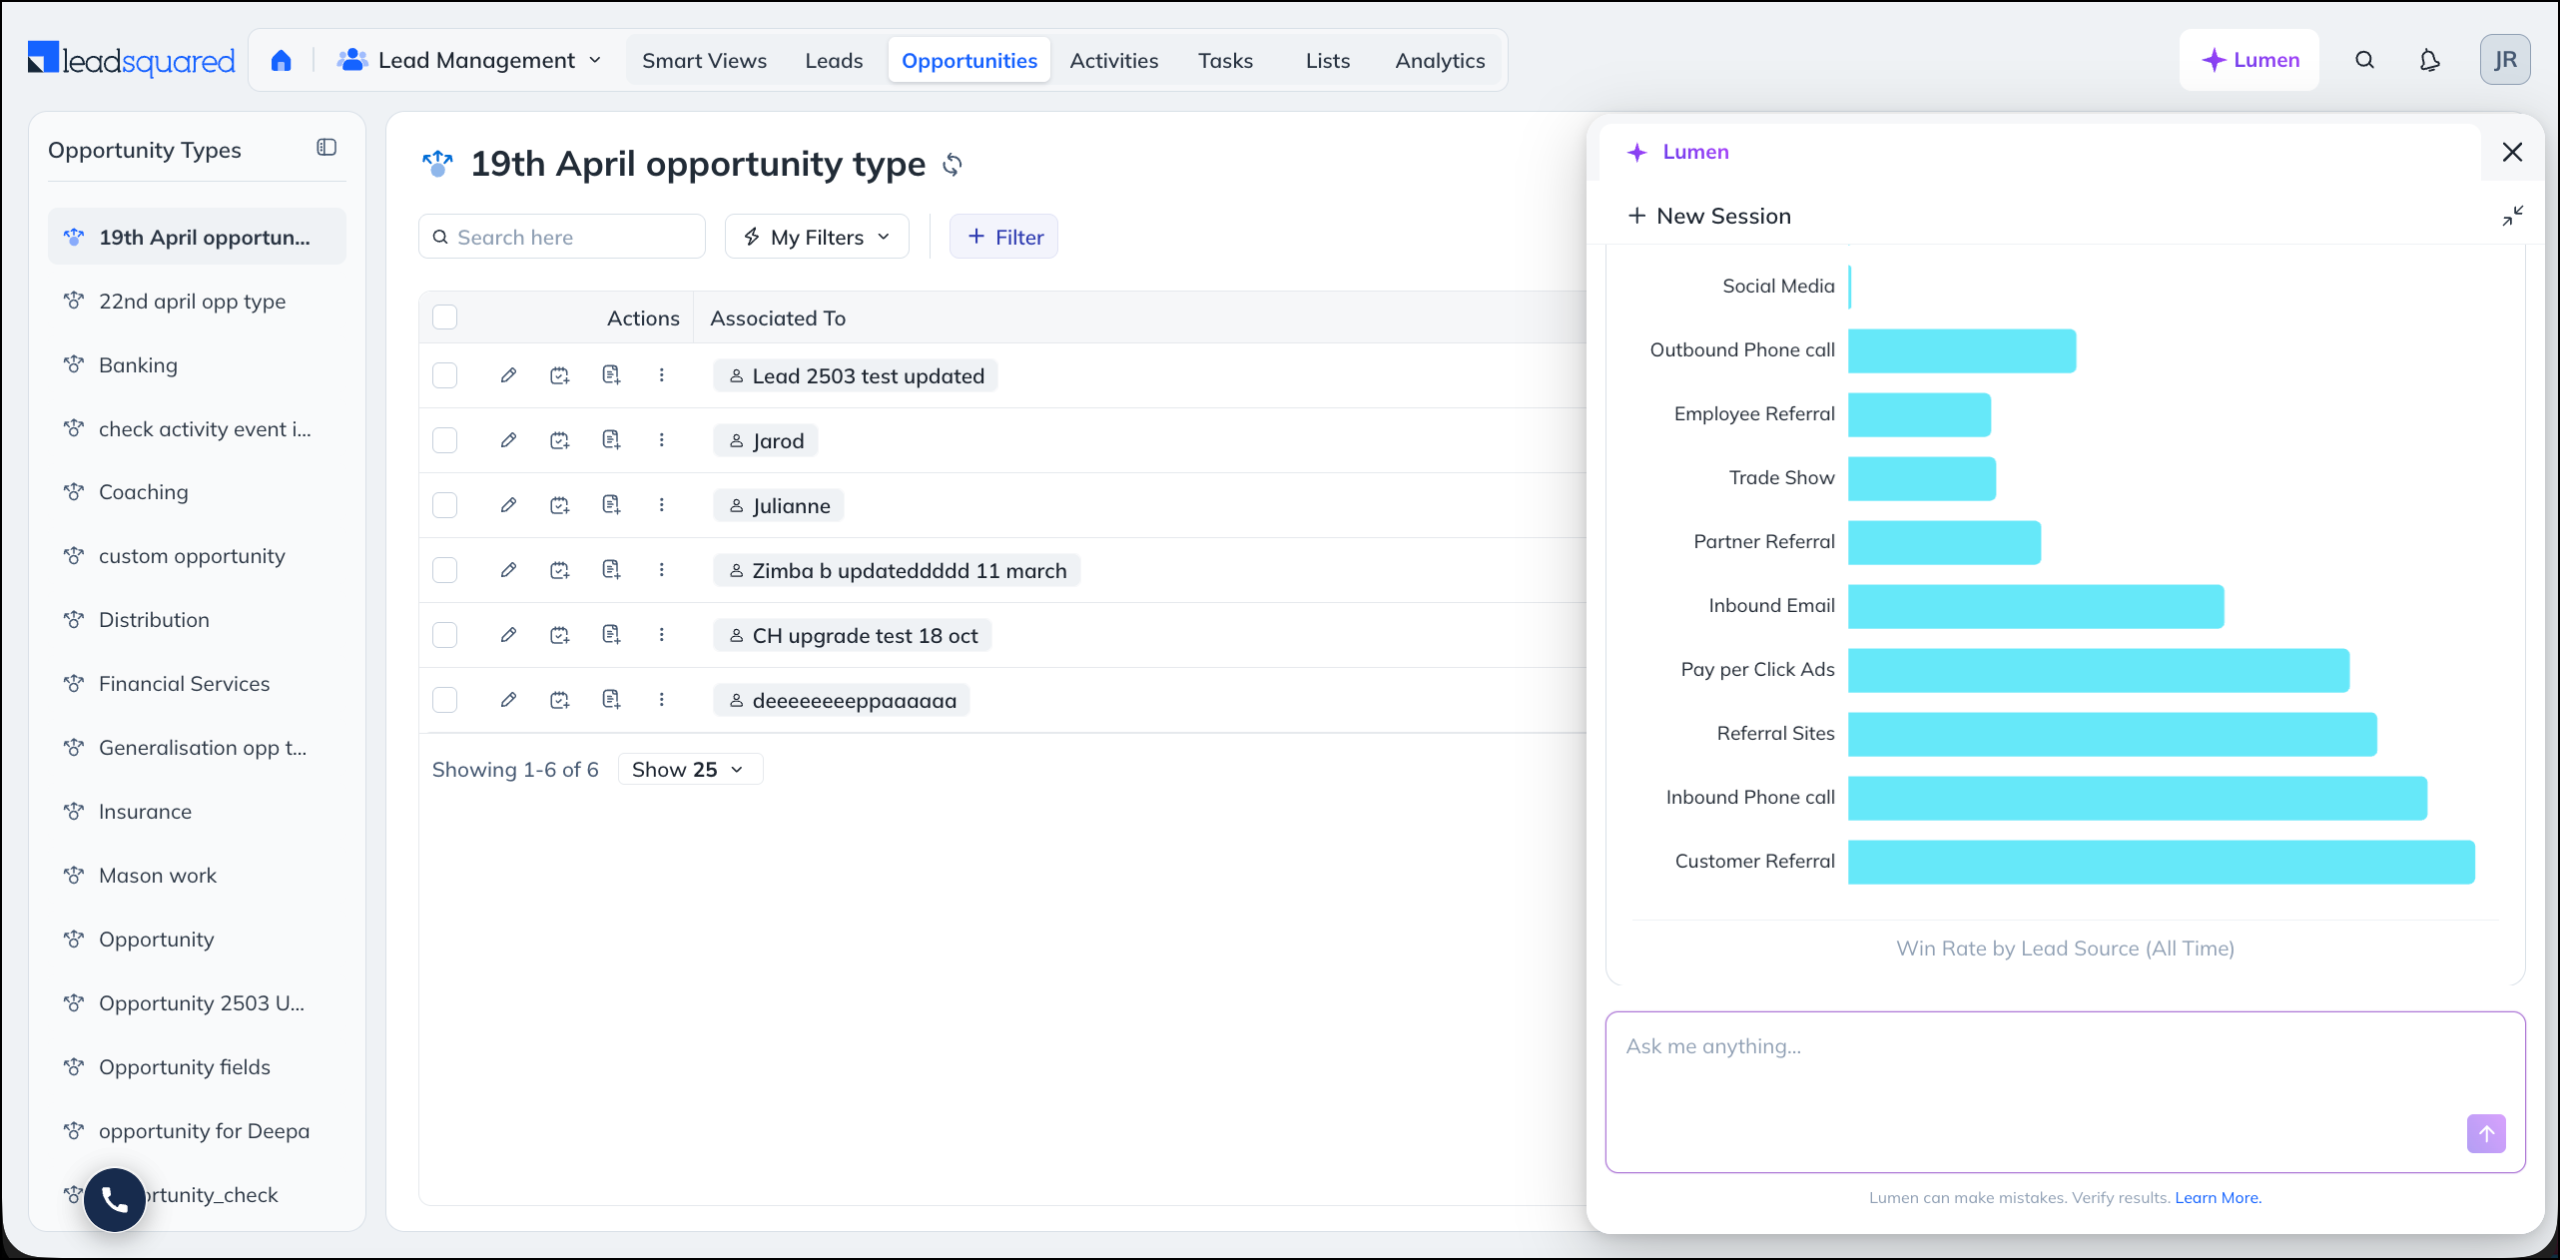
Lumen presents the result as a chart or a table, depending on the question.
5.5 Next Step
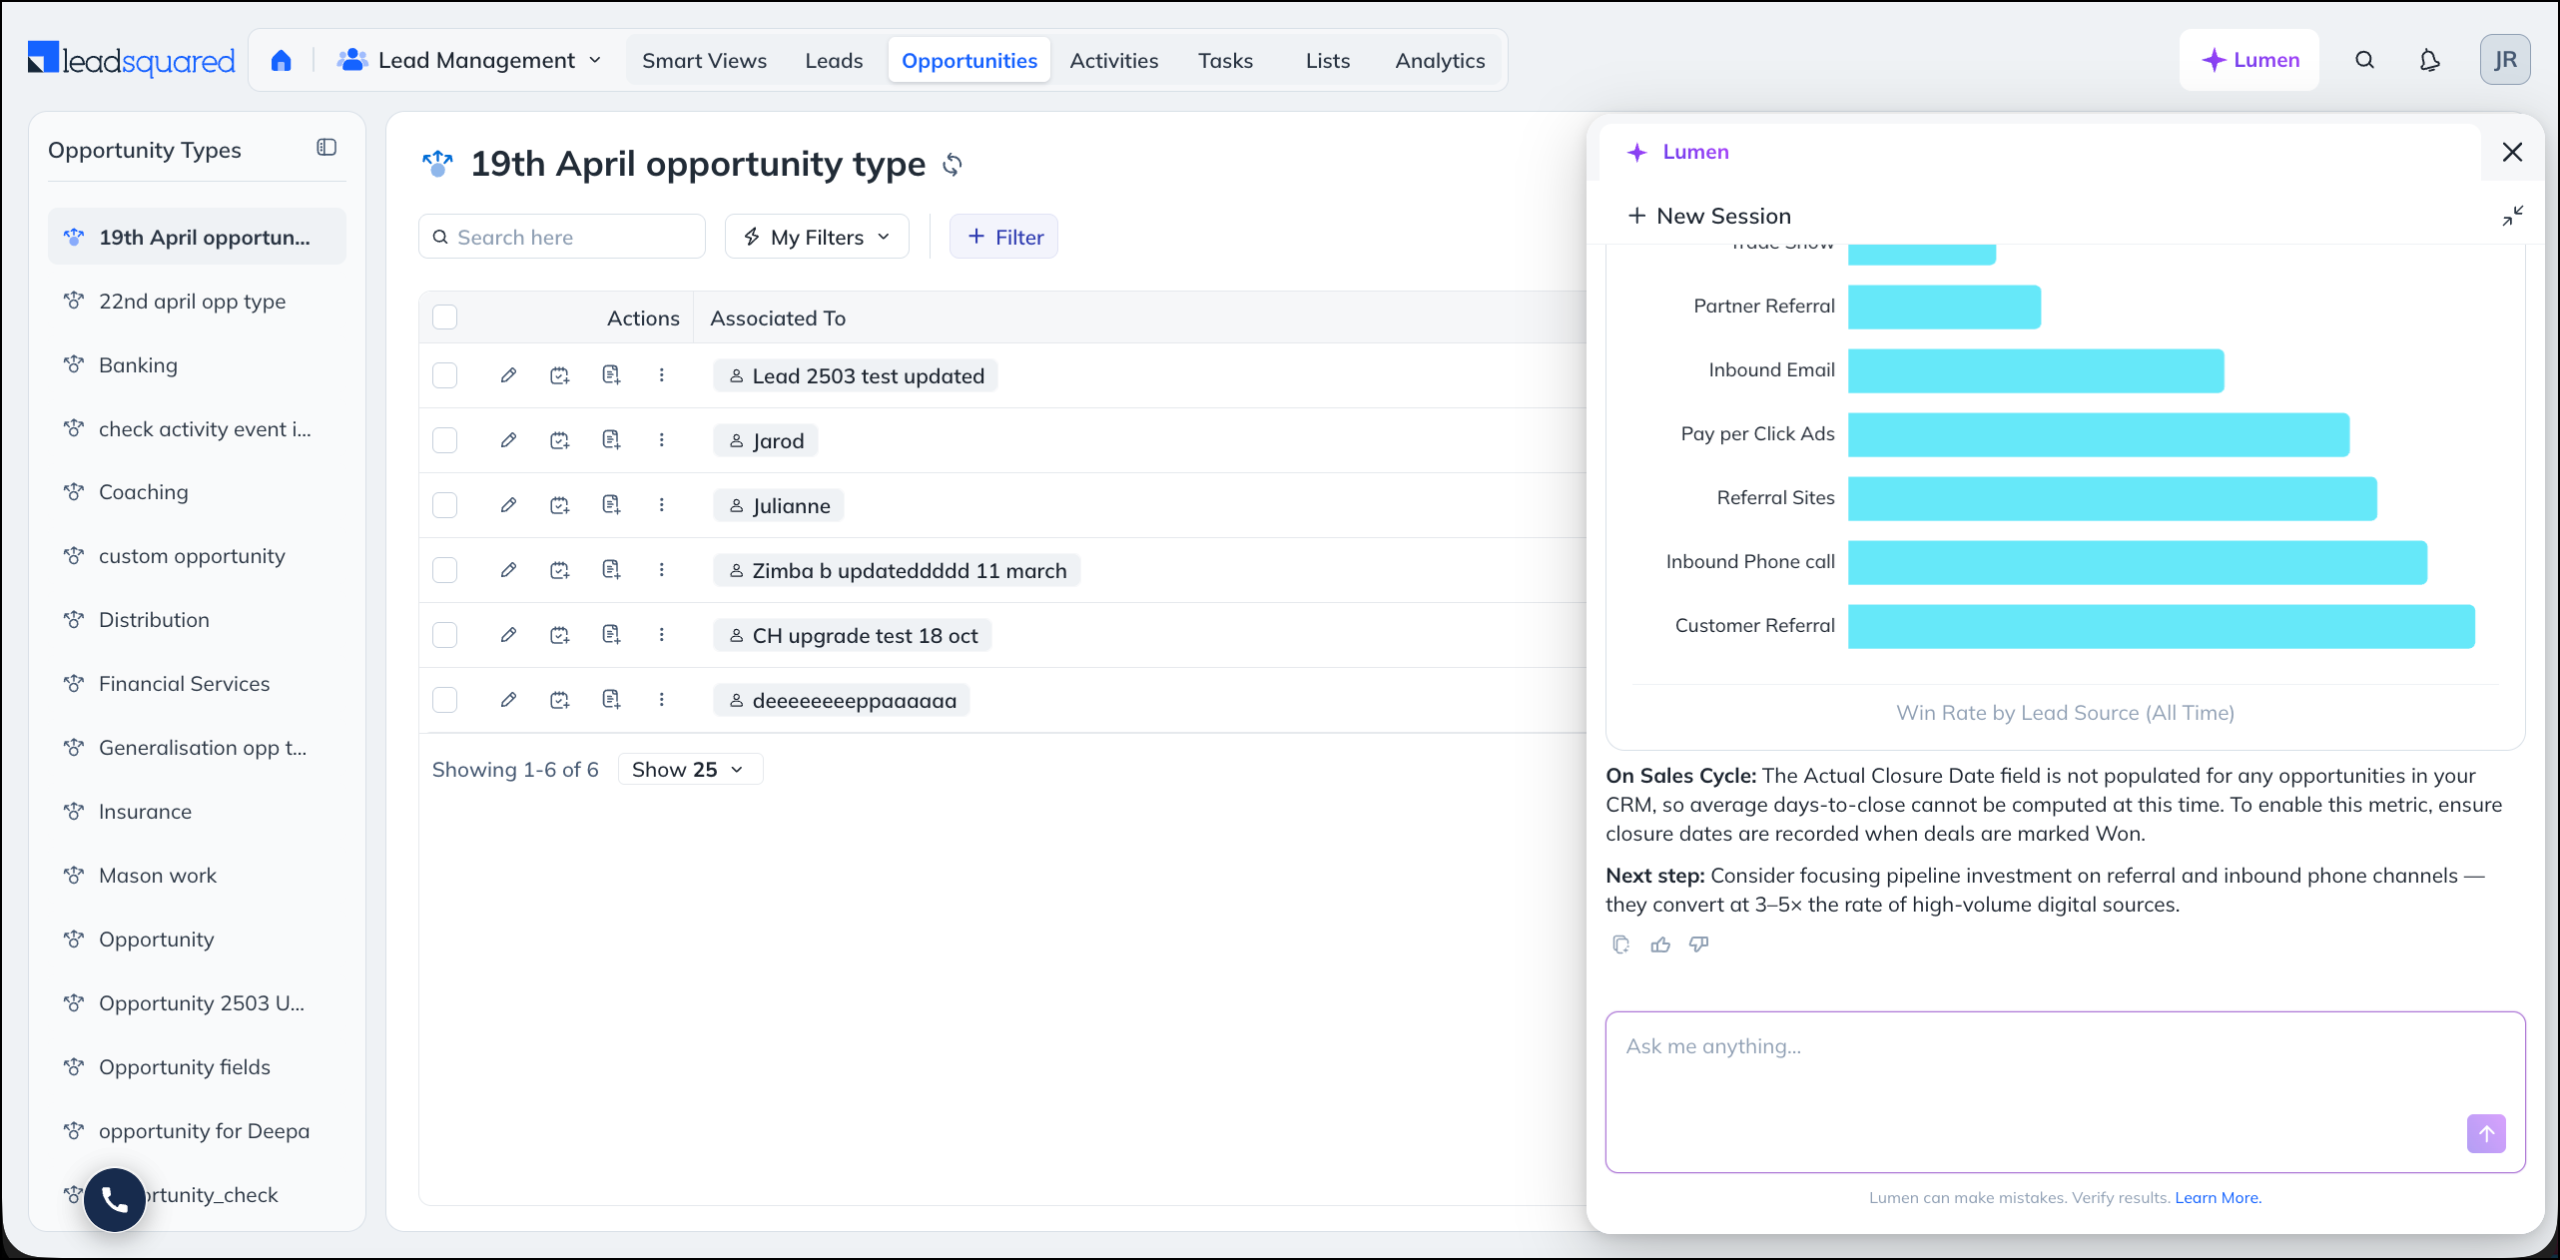
Lumen closes the response with a suggested next step. This is usually one of the following:
- An action that would improve the quality of future answers, such as populating a field that is currently blank.
- A follow-up question you can ask to break the result down further, for example by opportunity stage or owner.
6. Refine an Open-Ended Question
Lumen asks you for clarification when a question can be interpreted in more than one way.
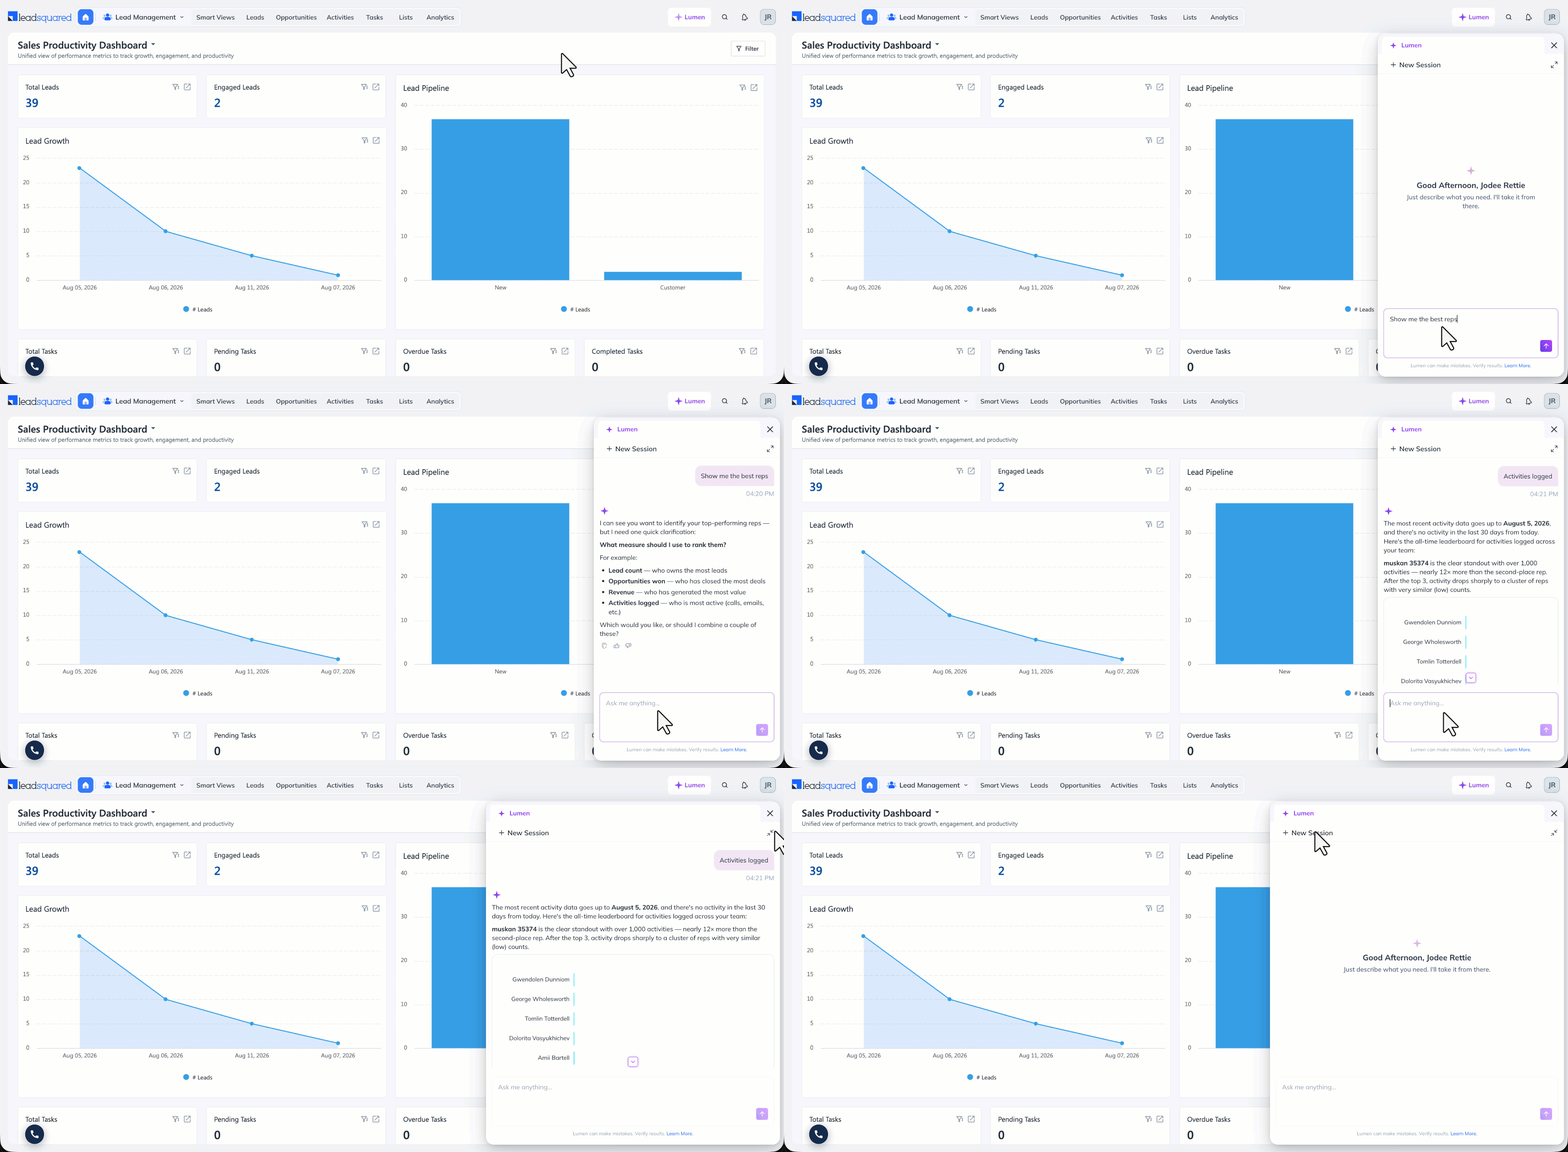
For example, if you enter Show me the best reps, Lumen asks how you define “best” before it runs any query. Reply with your definition, such as most tasks completed, and Lumen carries that context forward and generates the report.
Lumen retains the context of the conversation, so you can keep refining the result across several messages instead of rewriting your question each time. To start over with a clean context, click New Session.
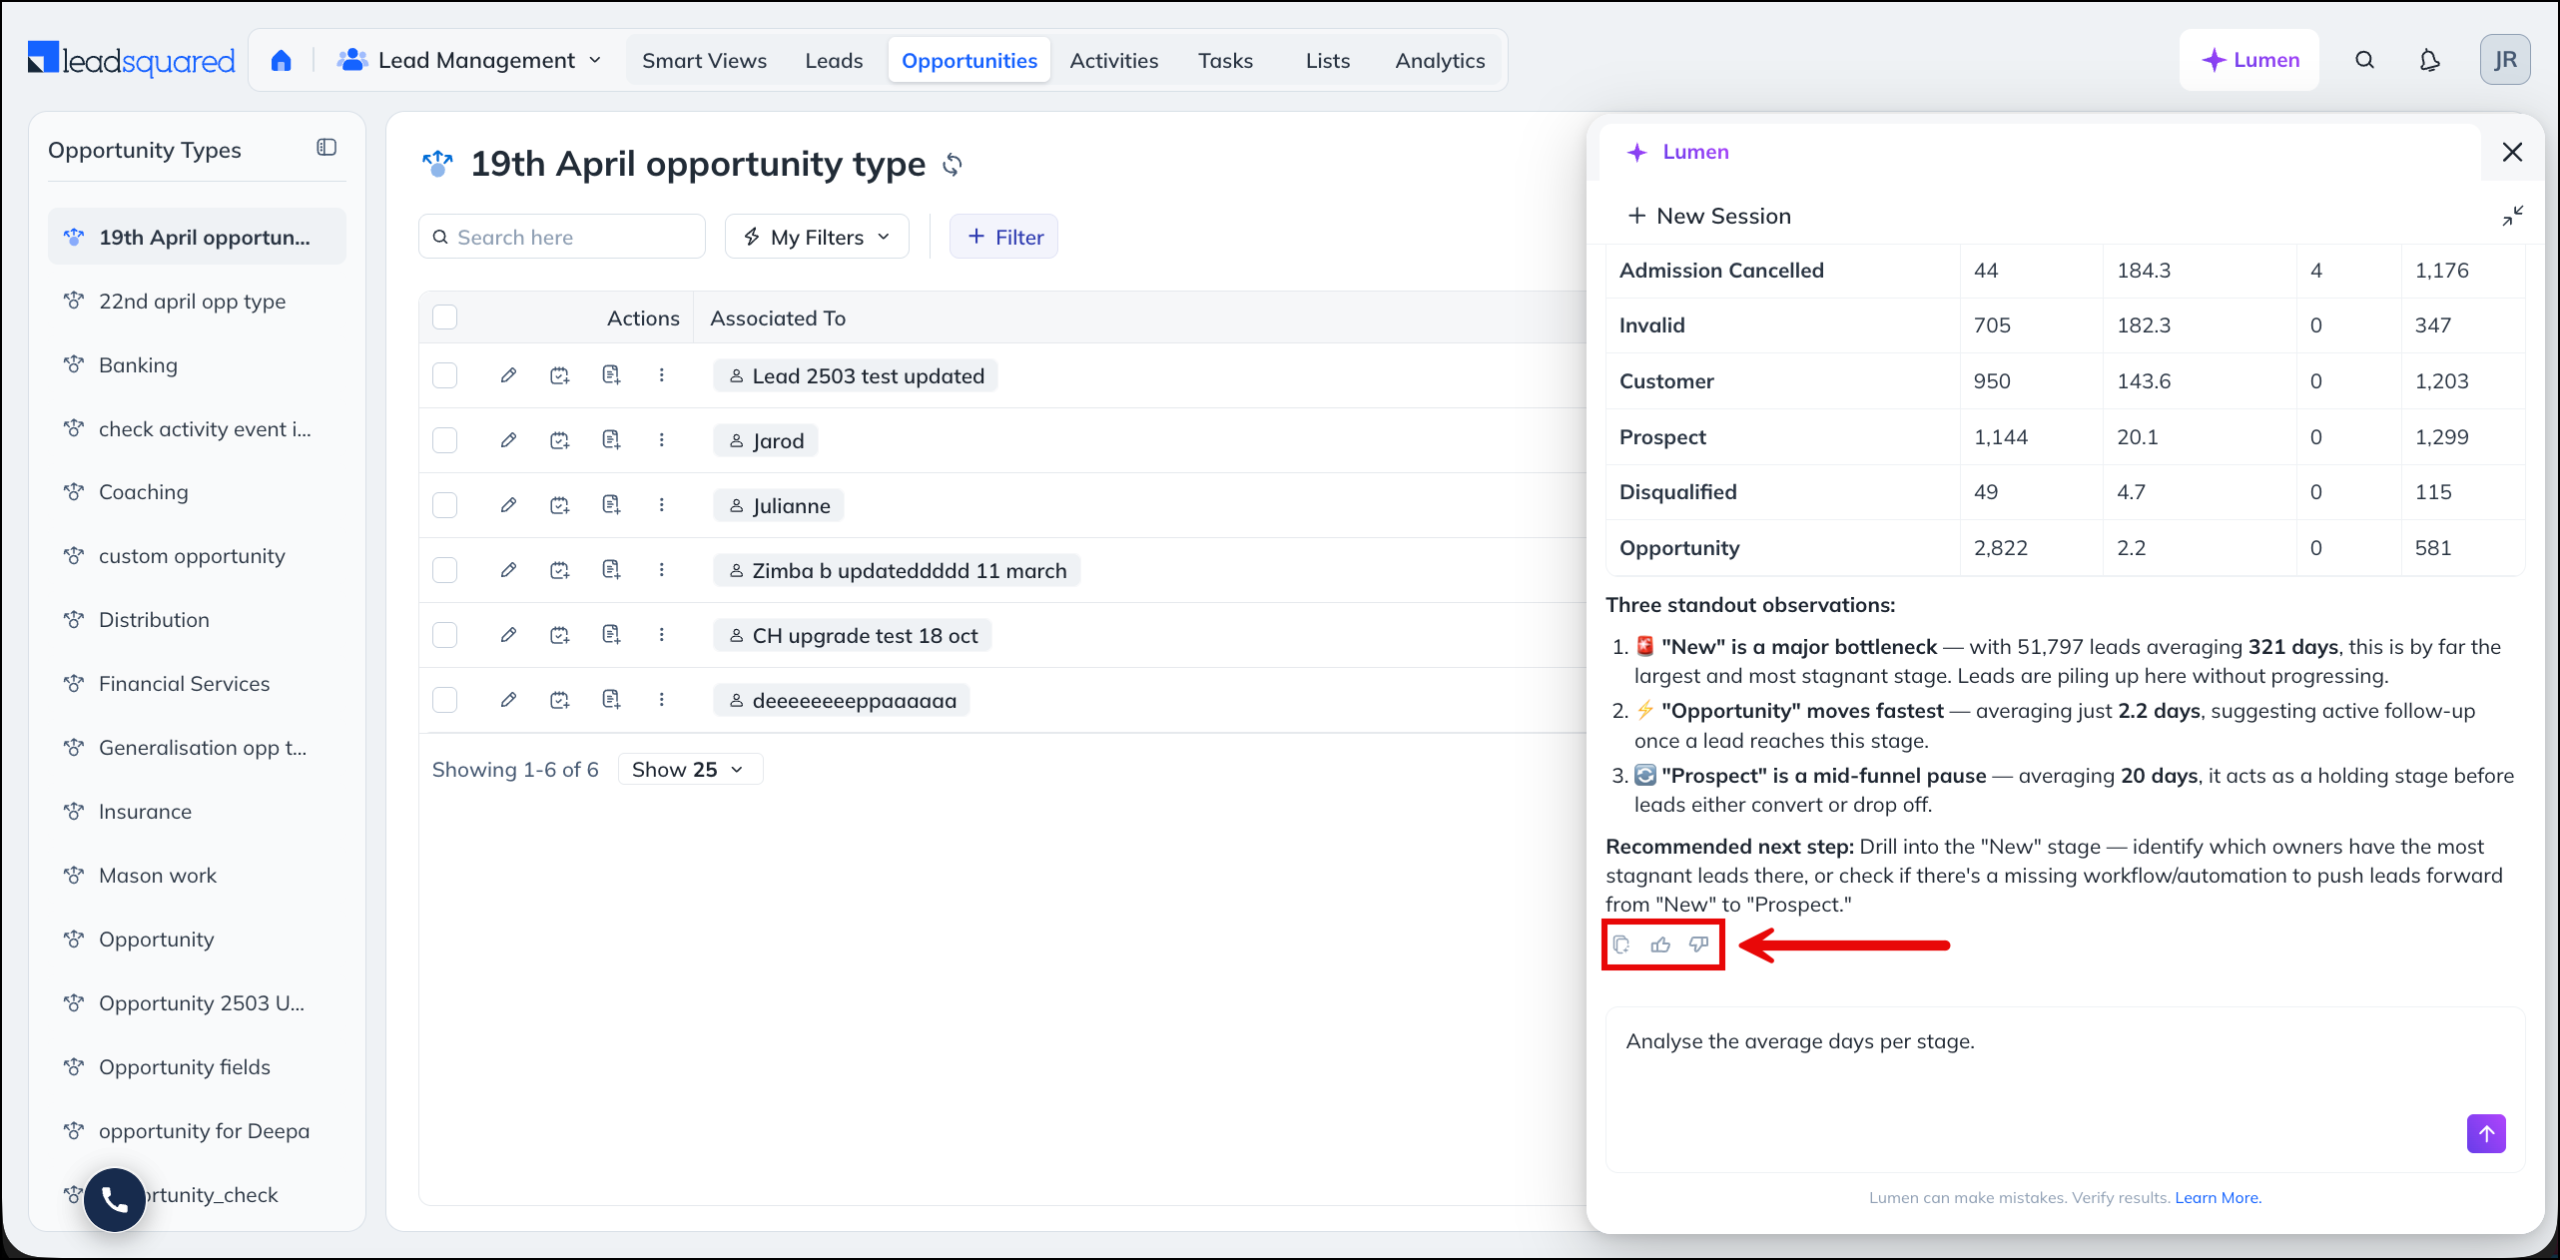
7. Copy a Response or Share Feedback
Each analytics response includes the following actions:
- Copy – Copies the response so you can paste it into a presentation, an email, or a document.
- Thumbs up – Tells the LeadSquared product team that the response was useful.
- Thumbs down – Tells the LeadSquared product team that the response missed something. Use this to report a figure that looks wrong or a question Lumen did not understand.
Feedback goes to the LeadSquared product team and helps improve future responses. It does not change the response shown in your panel.
8. Tips for Writing Effective Analytics Prompts
- Name the measure and the breakdown – Show me win rate by lead source is clearer than How are my leads doing.
- State the period you want – Include a period such as in the last 90 days or this quarter. If the period holds no data, Lumen tells you and widens the range.
- Start from a suggestion – Under the Try asking section, the suggested questions are phrased the way Lumen interprets best. Use them as a starting point and edit from there.
- Ask follow-up questions – Rather than writing one long prompt, ask a broad question first, then narrow the result across follow-up messages.
- Answer the clarifying question – When Lumen asks what you mean by a term such as “best” or “top”, give it a specific measure.
9. Limitations
Note the following when you use Lumen for analytics:
- Lumen can make mistakes. Always verify the figures before you share them, particularly in customer-facing or leadership reporting.
- Lumen cannot calculate a metric that depends on a field your account does not populate. It reports the gap in the response rather than returning an estimate.
Any Questions?
Did you find this article helpful? Please let us know any feedback you may have in the comments section below. We’d love to hear from you and help you out!