


Get Started

Sales Suite
Field Ops
Marketing
Service CRM
Integrations & Apps
FloStack
Invorto Voice Bot Analytics

1. Feature Overview
The Analytics module on the Invorto Voice Bot is where you review what your bots and campaigns actually did. It is a group in the left navigation with three pages, and each page answers a different question. All three pages are read-only.
| Page | Typical use |
| Voice Analytics | Confirming a campaign dialed as expected. |
| Insight Analytics | Reporting outcomes, intent, and tone back to the business. |
| Evaluations | Evaluating how well the bot handled the conversation. |
2. Prerequisites
- An active Invorto Voice Bot account.
- At least one campaign that has run in the period you select.
- For Insight Analytics, a campaign with Enable Call Analysis turned on and an Analysis Config selected, or an Insight campaign with completed transcriptions.
- For Evaluations, a published bot with conversations that Invorto has already evaluated.
3. Open the Analytics Pages
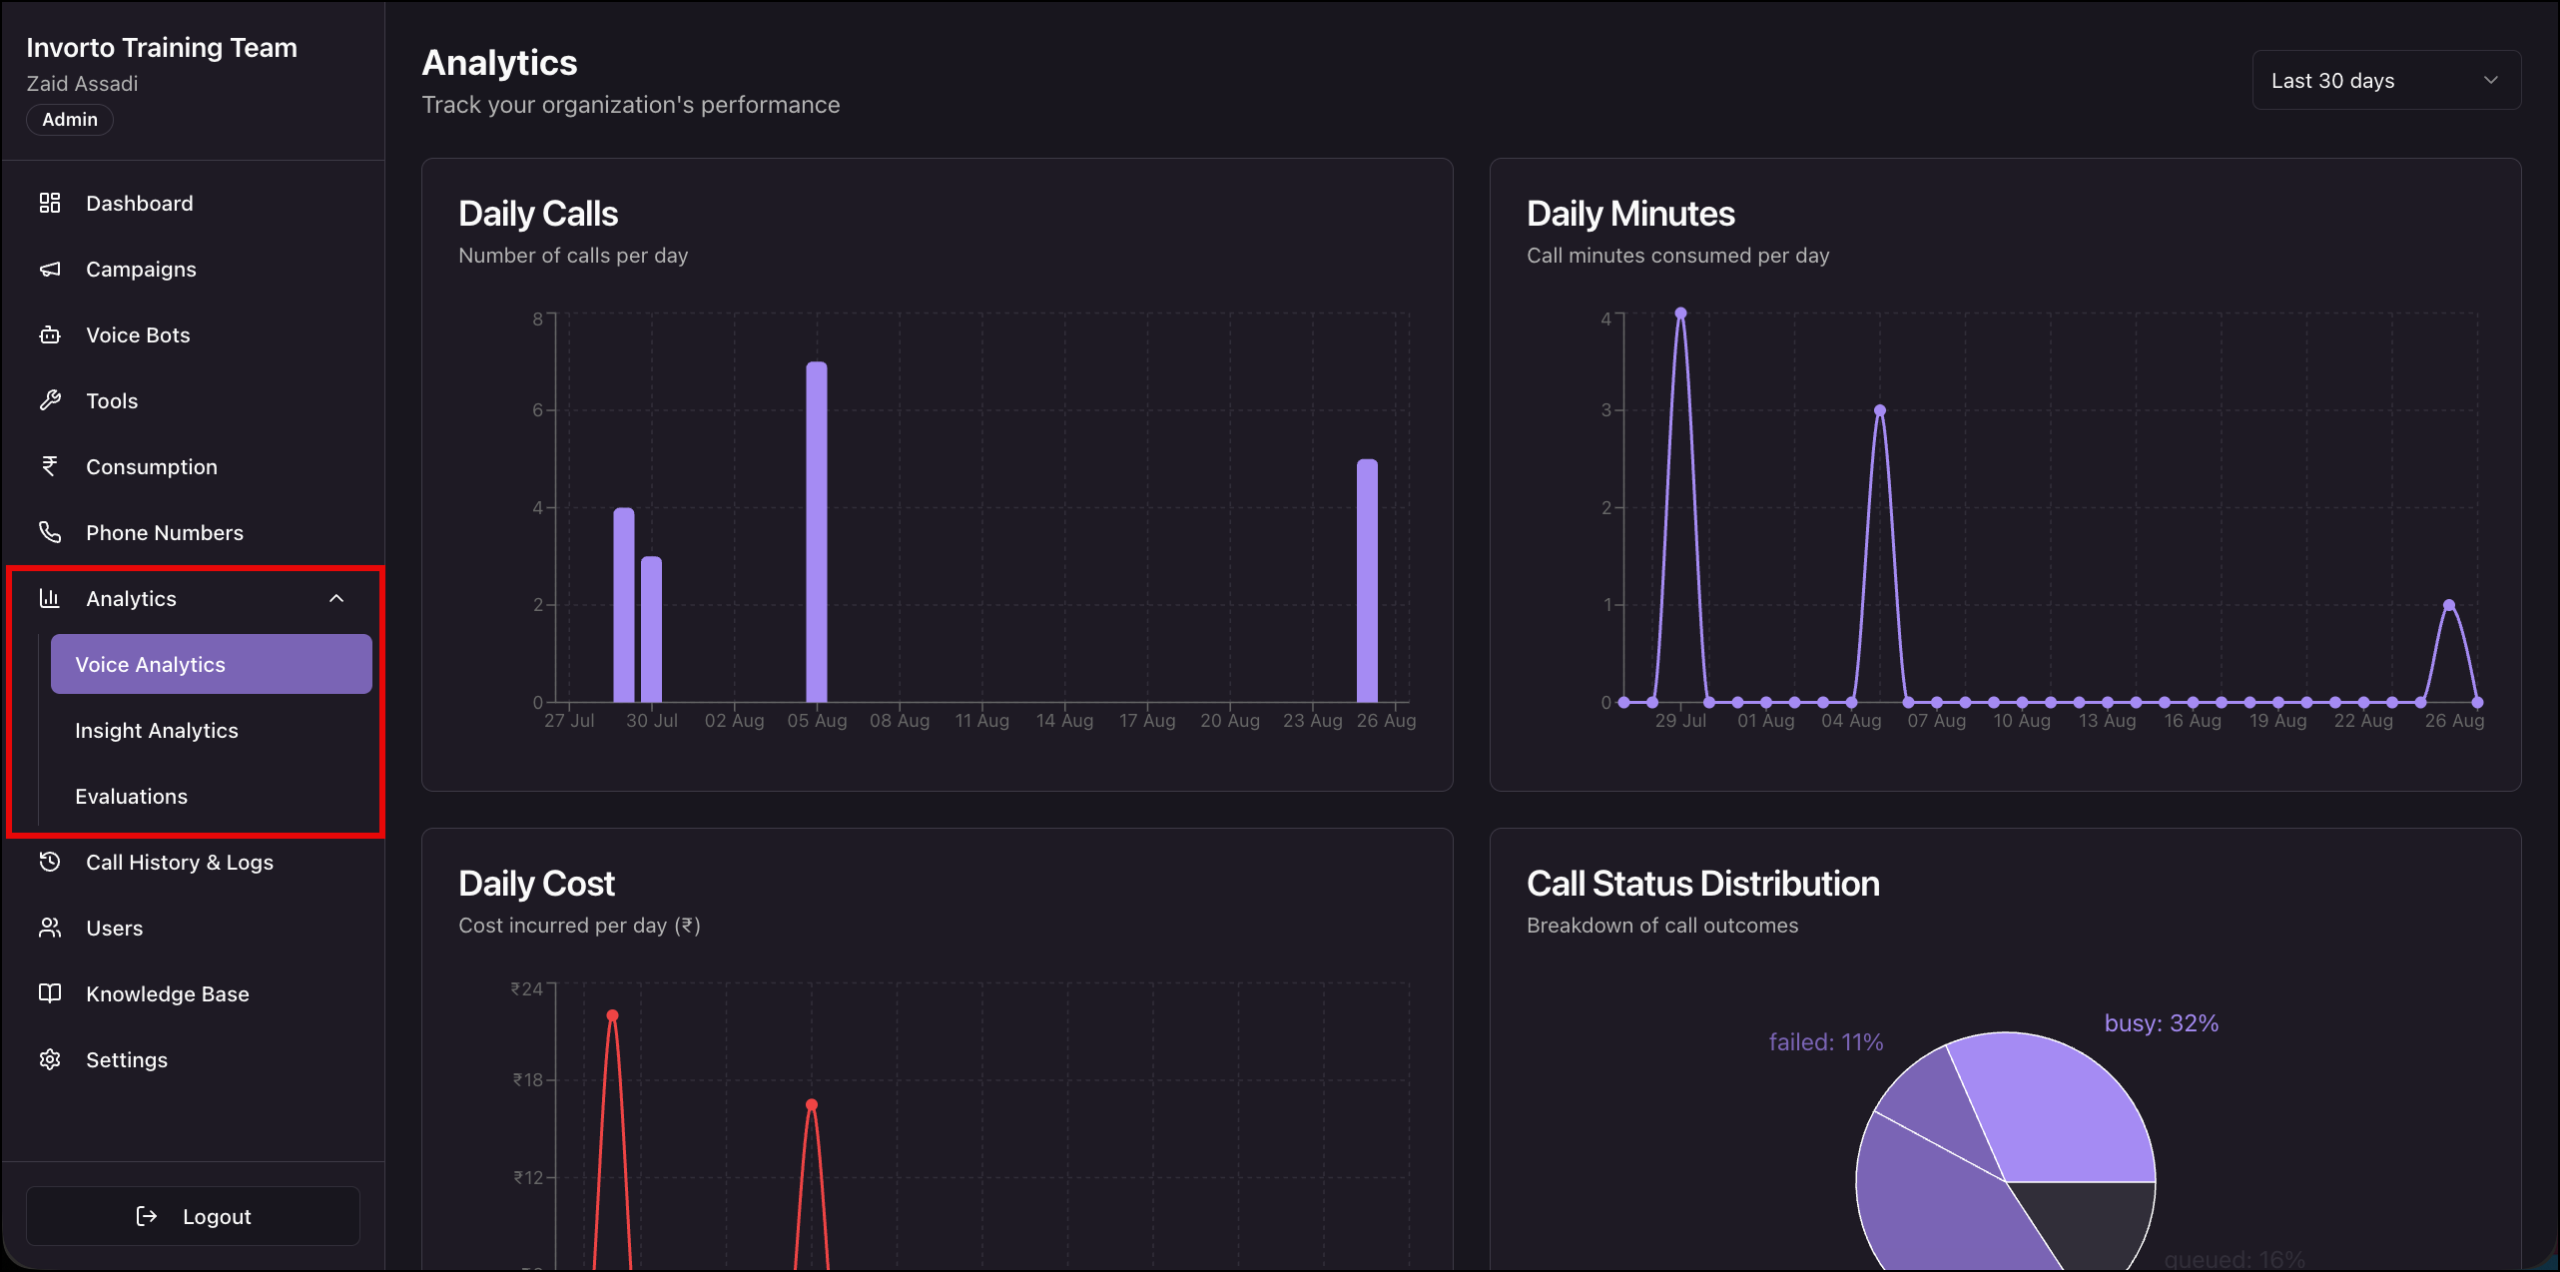
- In the left navigation, click Analytics to expand the group.
- Click Voice Analytics, Insight Analytics, or Evaluations.
Each page has its own date range selector in the top right. Setting the range on one page does not set it on the others.
4. Voice Analytics
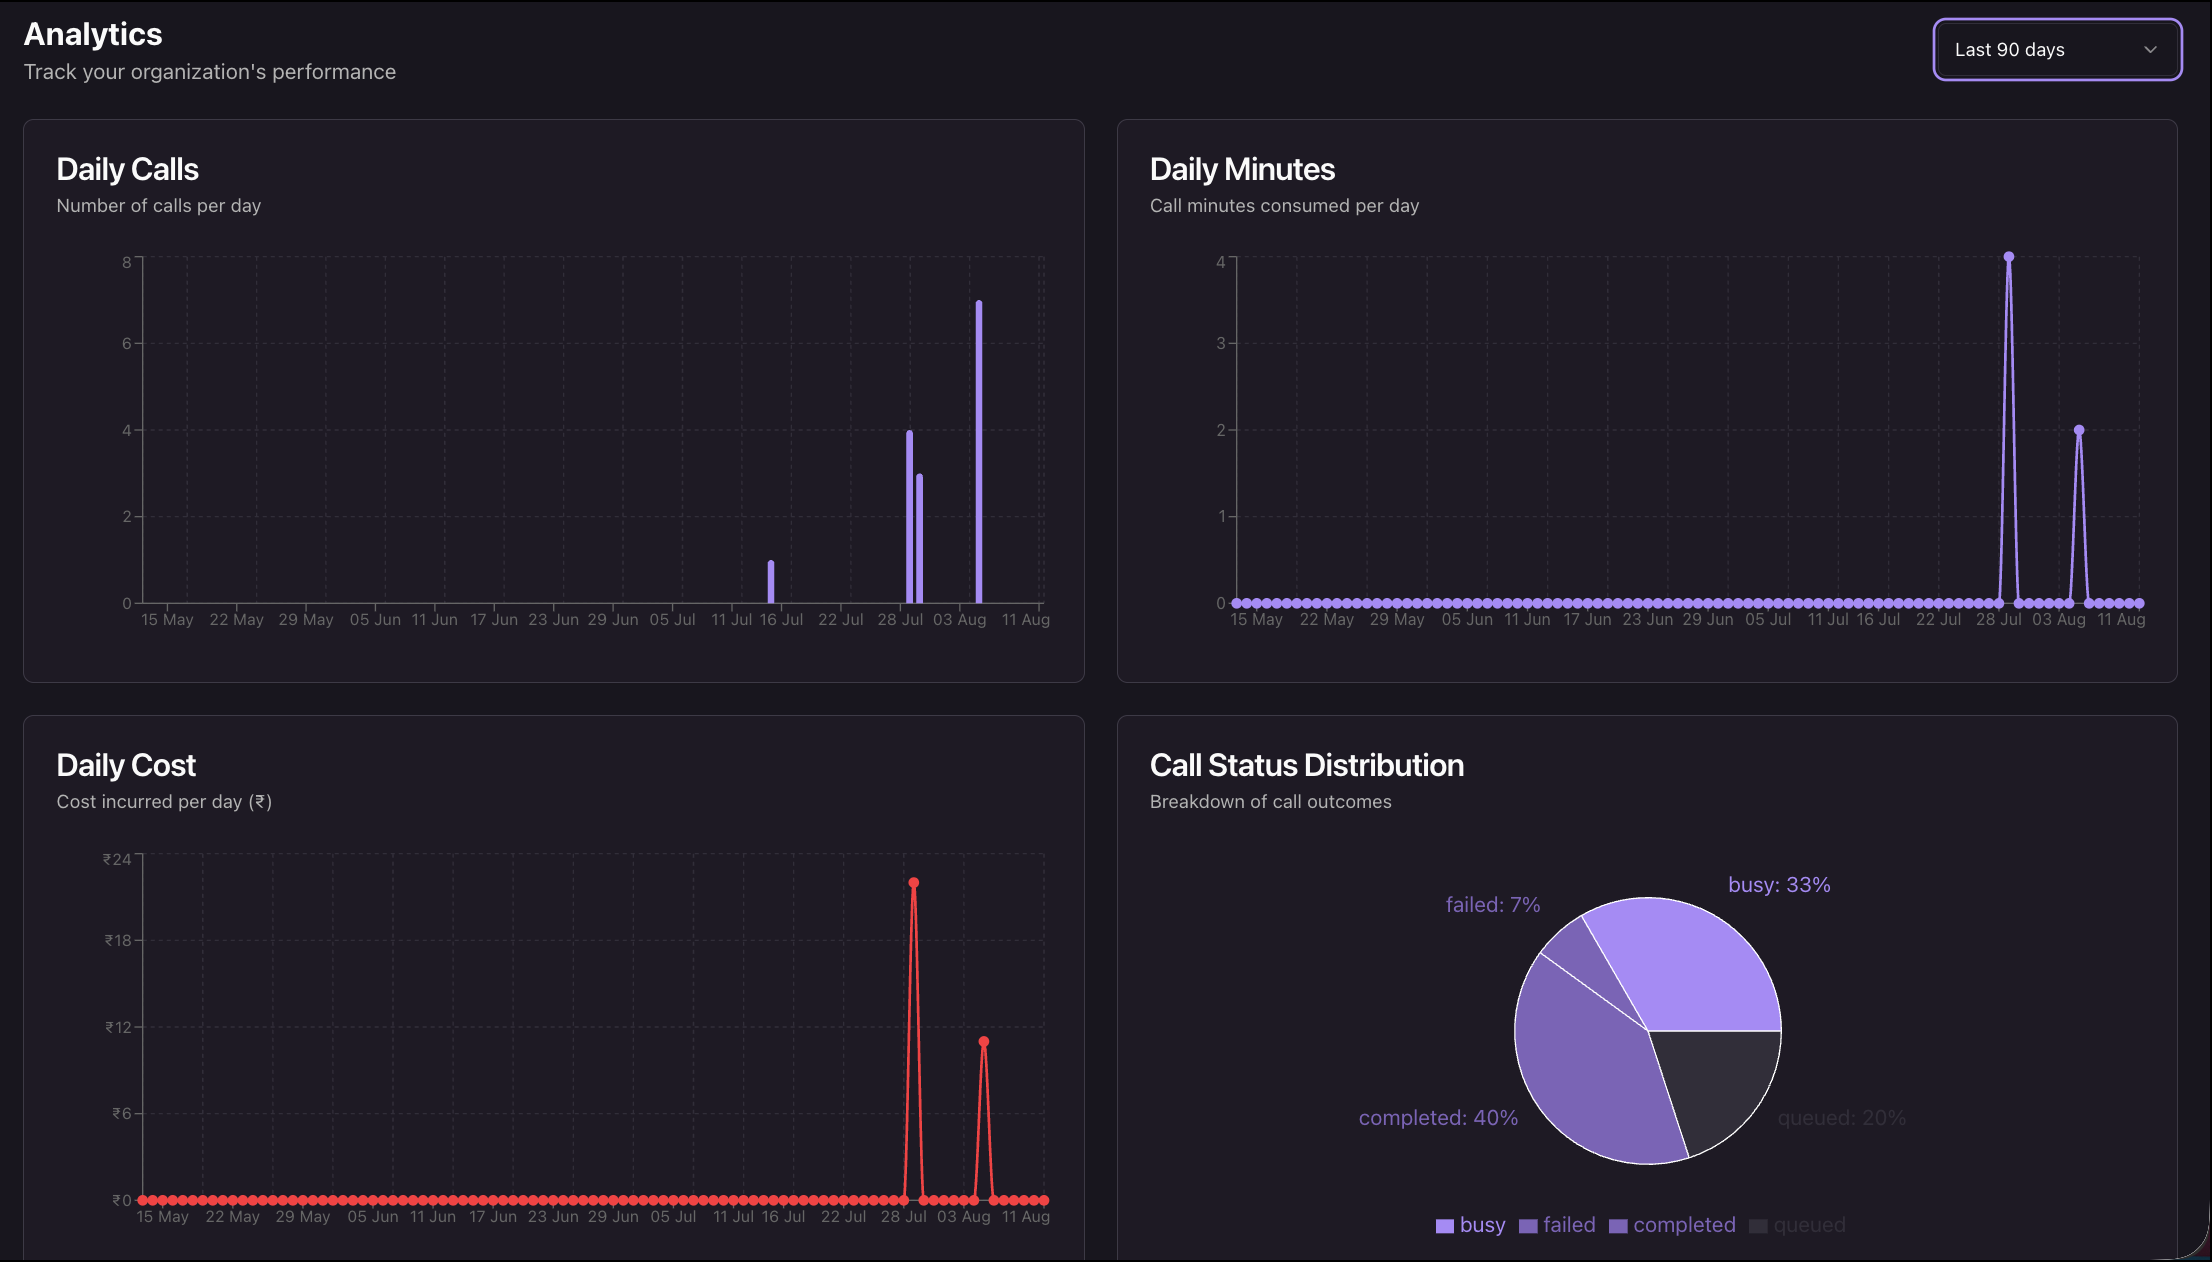
Voice Analytics shows the volume and shape of your calling activity over time. It counts calls, it does not judge them. Insight campaigns do not place calls, so they do not appear on this page.
4.1 Set the Date Range
Click the date range selector in the top right and select the period you want to review. The four charts refresh together. If a chart is empty, no calls were placed in that period.
4.2 Read the Charts
| Chart | What it shows |
| Daily Calls | The number of calls placed per day, as a bar chart. |
| Daily Minutes | Call minutes consumed per day, as a line chart. |
| Daily Cost | Cost incurred per day, as a line chart. |
| Call Status Distribution | A breakdown of call outcomes across the period.
|
5. Insight Analytics
Insight Analytics aggregates the call analysis Invorto runs after each call. Where Voice Analytics counts calls, Insight Analytics tells you what happened inside them.
The data comes from the Call Insights tab of the bot that ran the call. Call Insights must be enabled on the bot. The charts on this page summarize the default fields that Call Insights captures, including the call outcome, the call score, the sentiment, and the actionable insights.
Insight Analytics covers both products. Voice campaigns contribute the calls the bot placed. Insight campaigns contribute the recordings you uploaded.
5.1 Read the Headline Metrics
| Tile | What it shows |
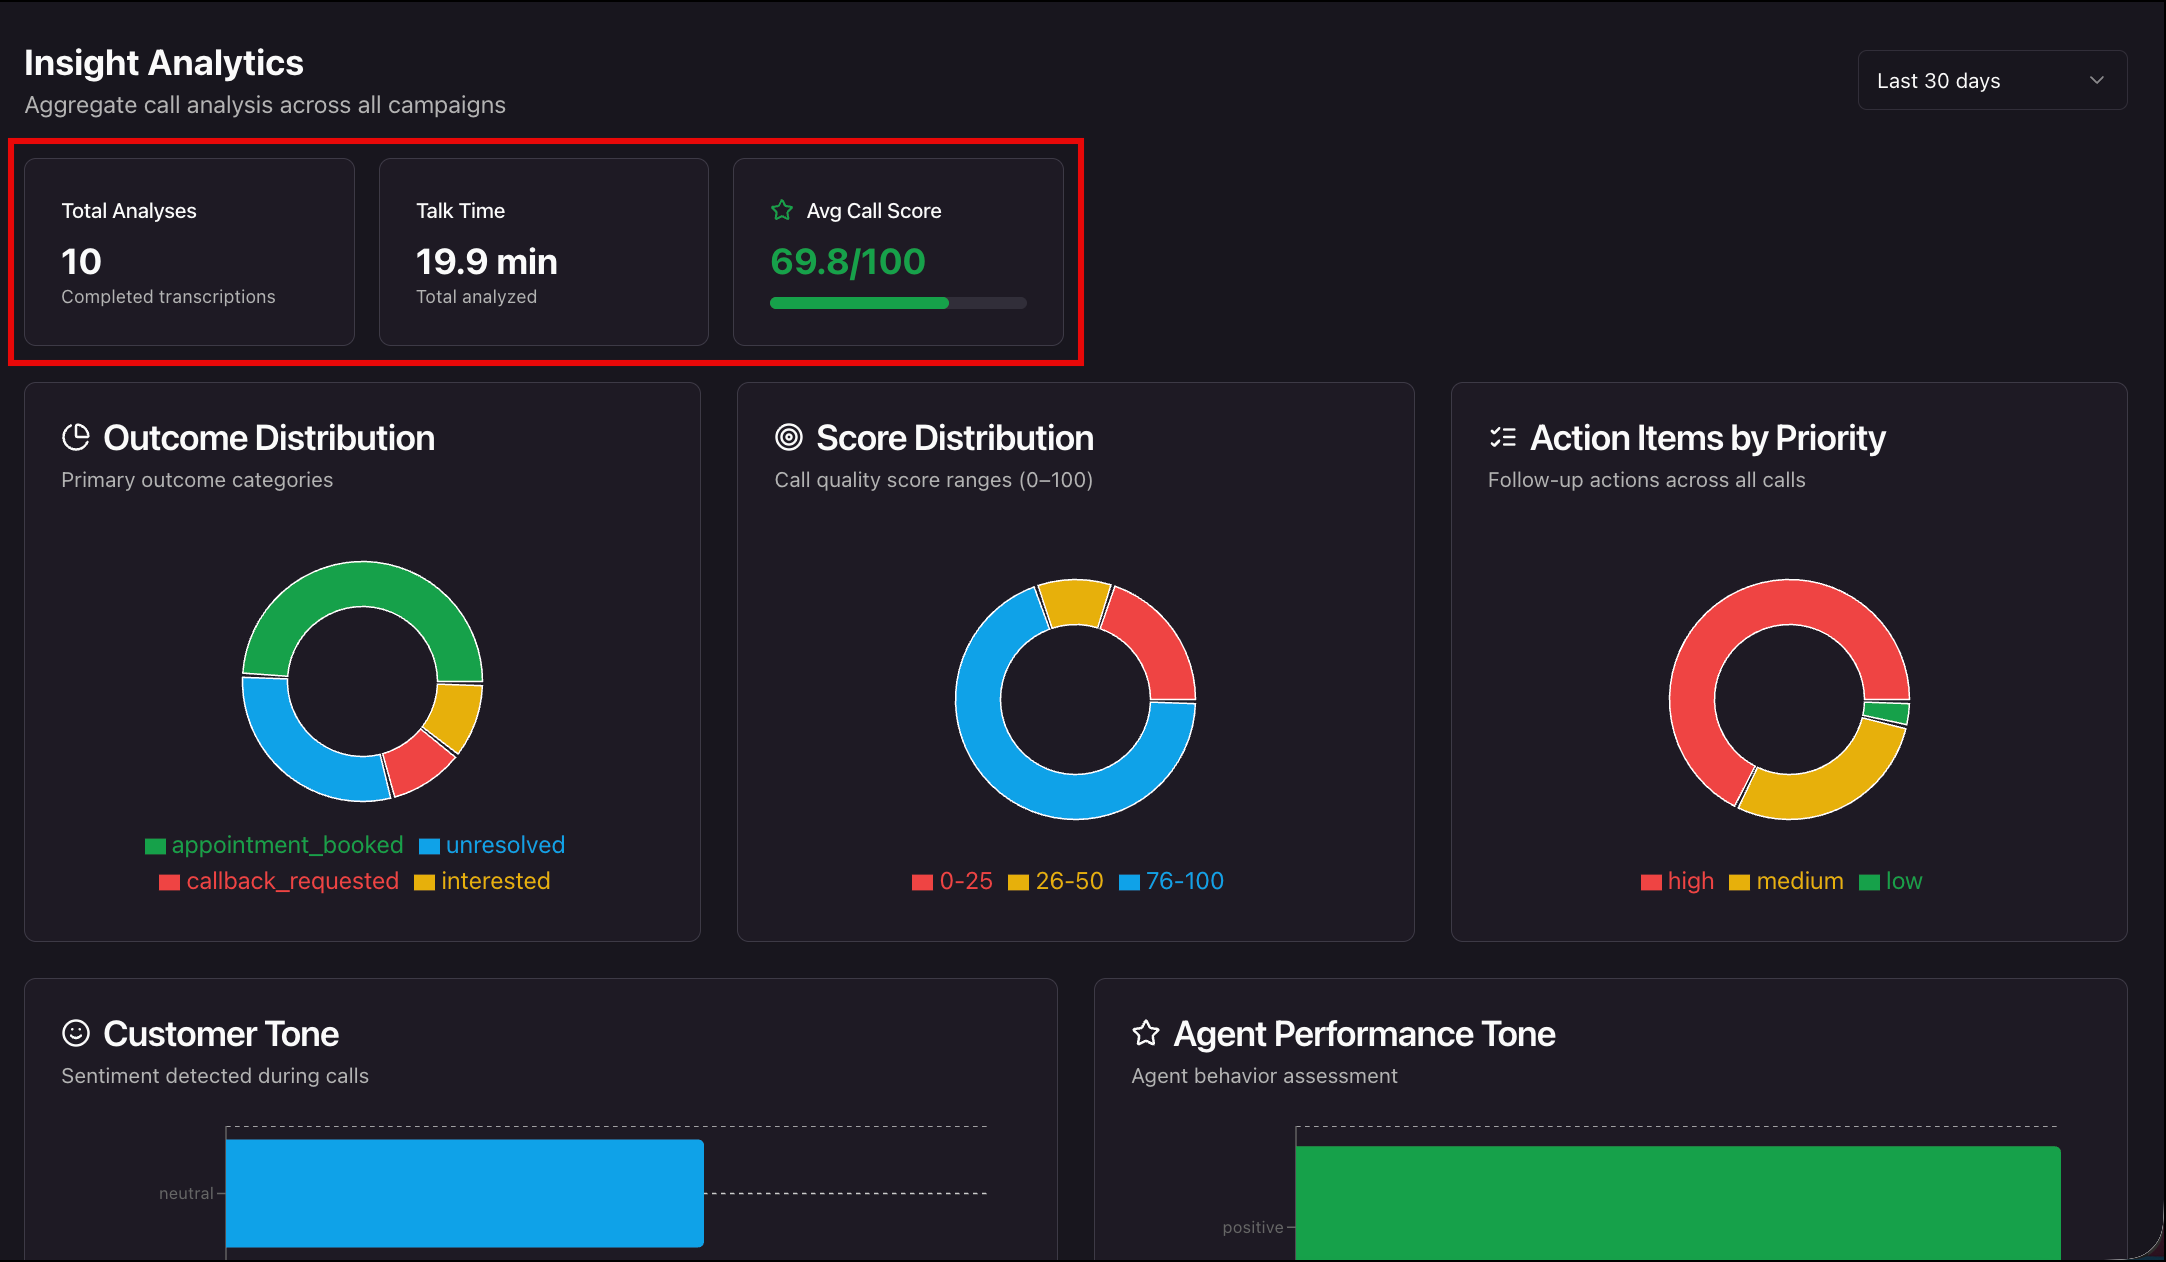
| Total Analyses | The number of completed transcriptions analyzed in the selected period. |
| Talk Time | The total talk time across those analyses. |
| Avg Call Score | The average call score across those analyses, out of 100. |
If no calls were analyzed in the selected period, the page tells you that no analytics data is available. Widen the date range, or confirm that call analysis was enabled on the campaign.
5.2 Read the Insight Charts
| Chart | Type | What it shows |
| Outcome Distribution | Donut | How calls split across the primary outcome categories, for example a booked appointment or a requested callback. |
| Score Distribution | Donut | How analyzed calls spread across call quality score bands from 0 to 100. |
| Action Items by Priority | Donut | The follow-up actions captured across all calls, grouped by priority. |
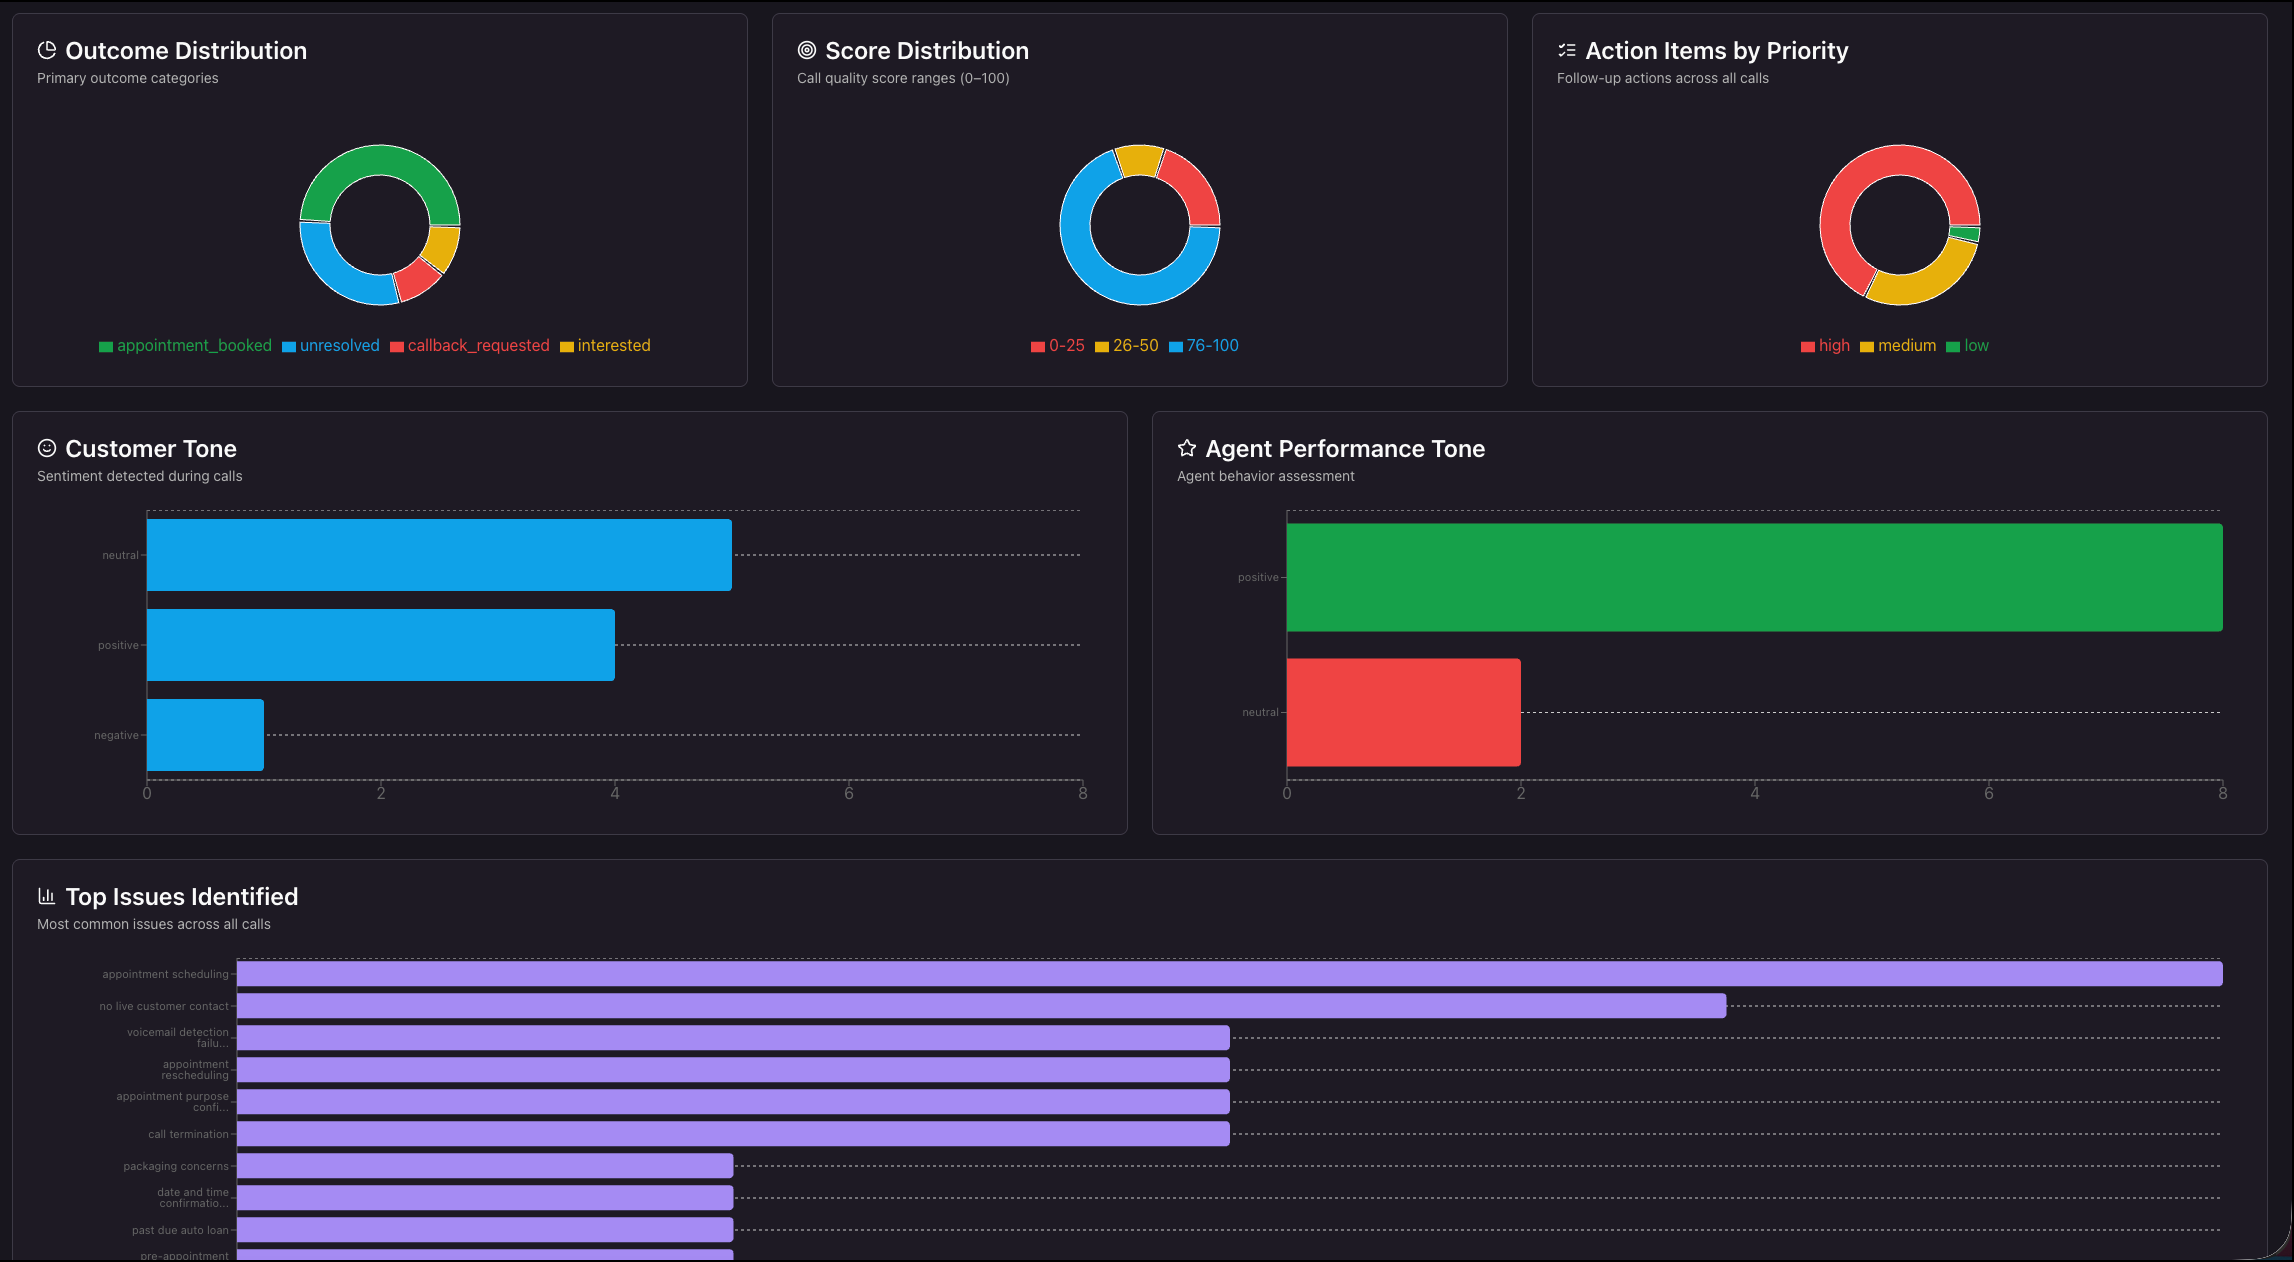
| Customer Tone | Horizontal bar | The sentiment detected in the customer’s speech during the calls. |
| Agent Performance Tone | Horizontal bar | An assessment of how the bot behaved during the calls. |
| Top Issues Identified | Horizontal bar | The issues that came up most often across all calls. |
6. Evaluations
Evaluations scores how well your bots hold a conversation. Invorto samples completed conversations, has an LLM judge score each one against five quality dimensions, and combines those scores into a single Composite Score out of 100.
The page has four panels: Composite Score, Conversation Quality, System Health, and How the Score is Calculated.
Use Evaluations after a campaign has run to decide whether a bot is ready for a wider audience, and to work out which part of the system prompt to fix.
6.1 Filter the Results
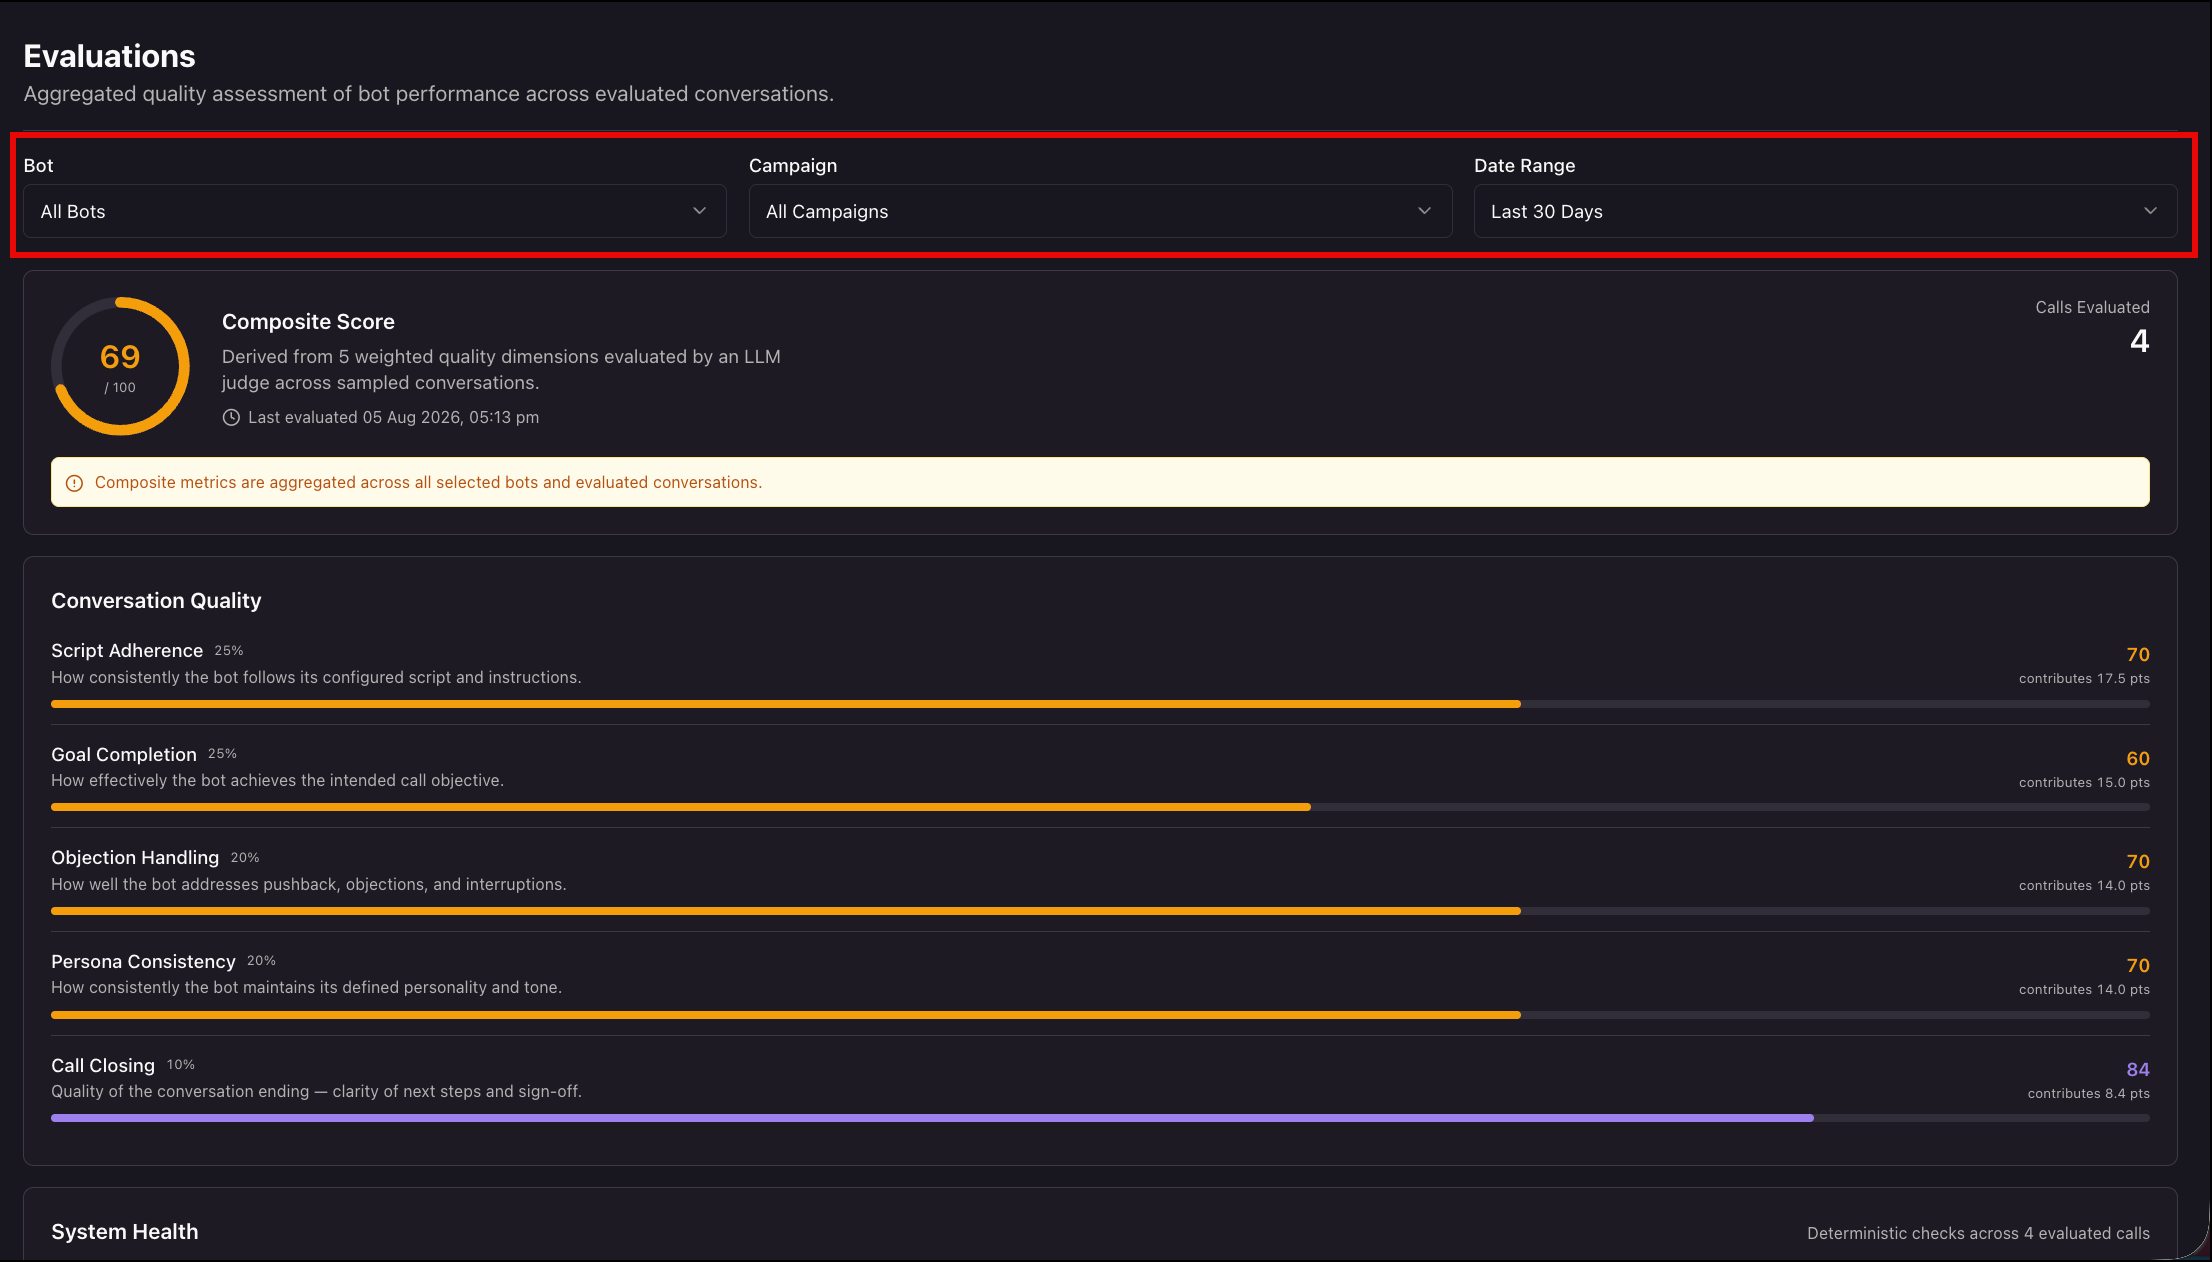
Three dropdowns across the top of the page control what is scored.
| Filter | What it does |
| Bot | Limits the score to a single bot, or to all bots in your organization. |
| Campaign | Limits the score to a single campaign, or to all campaigns. |
| Date Range | Limits the score to conversations evaluated in the selected period. |
6.2 Read the Composite Score
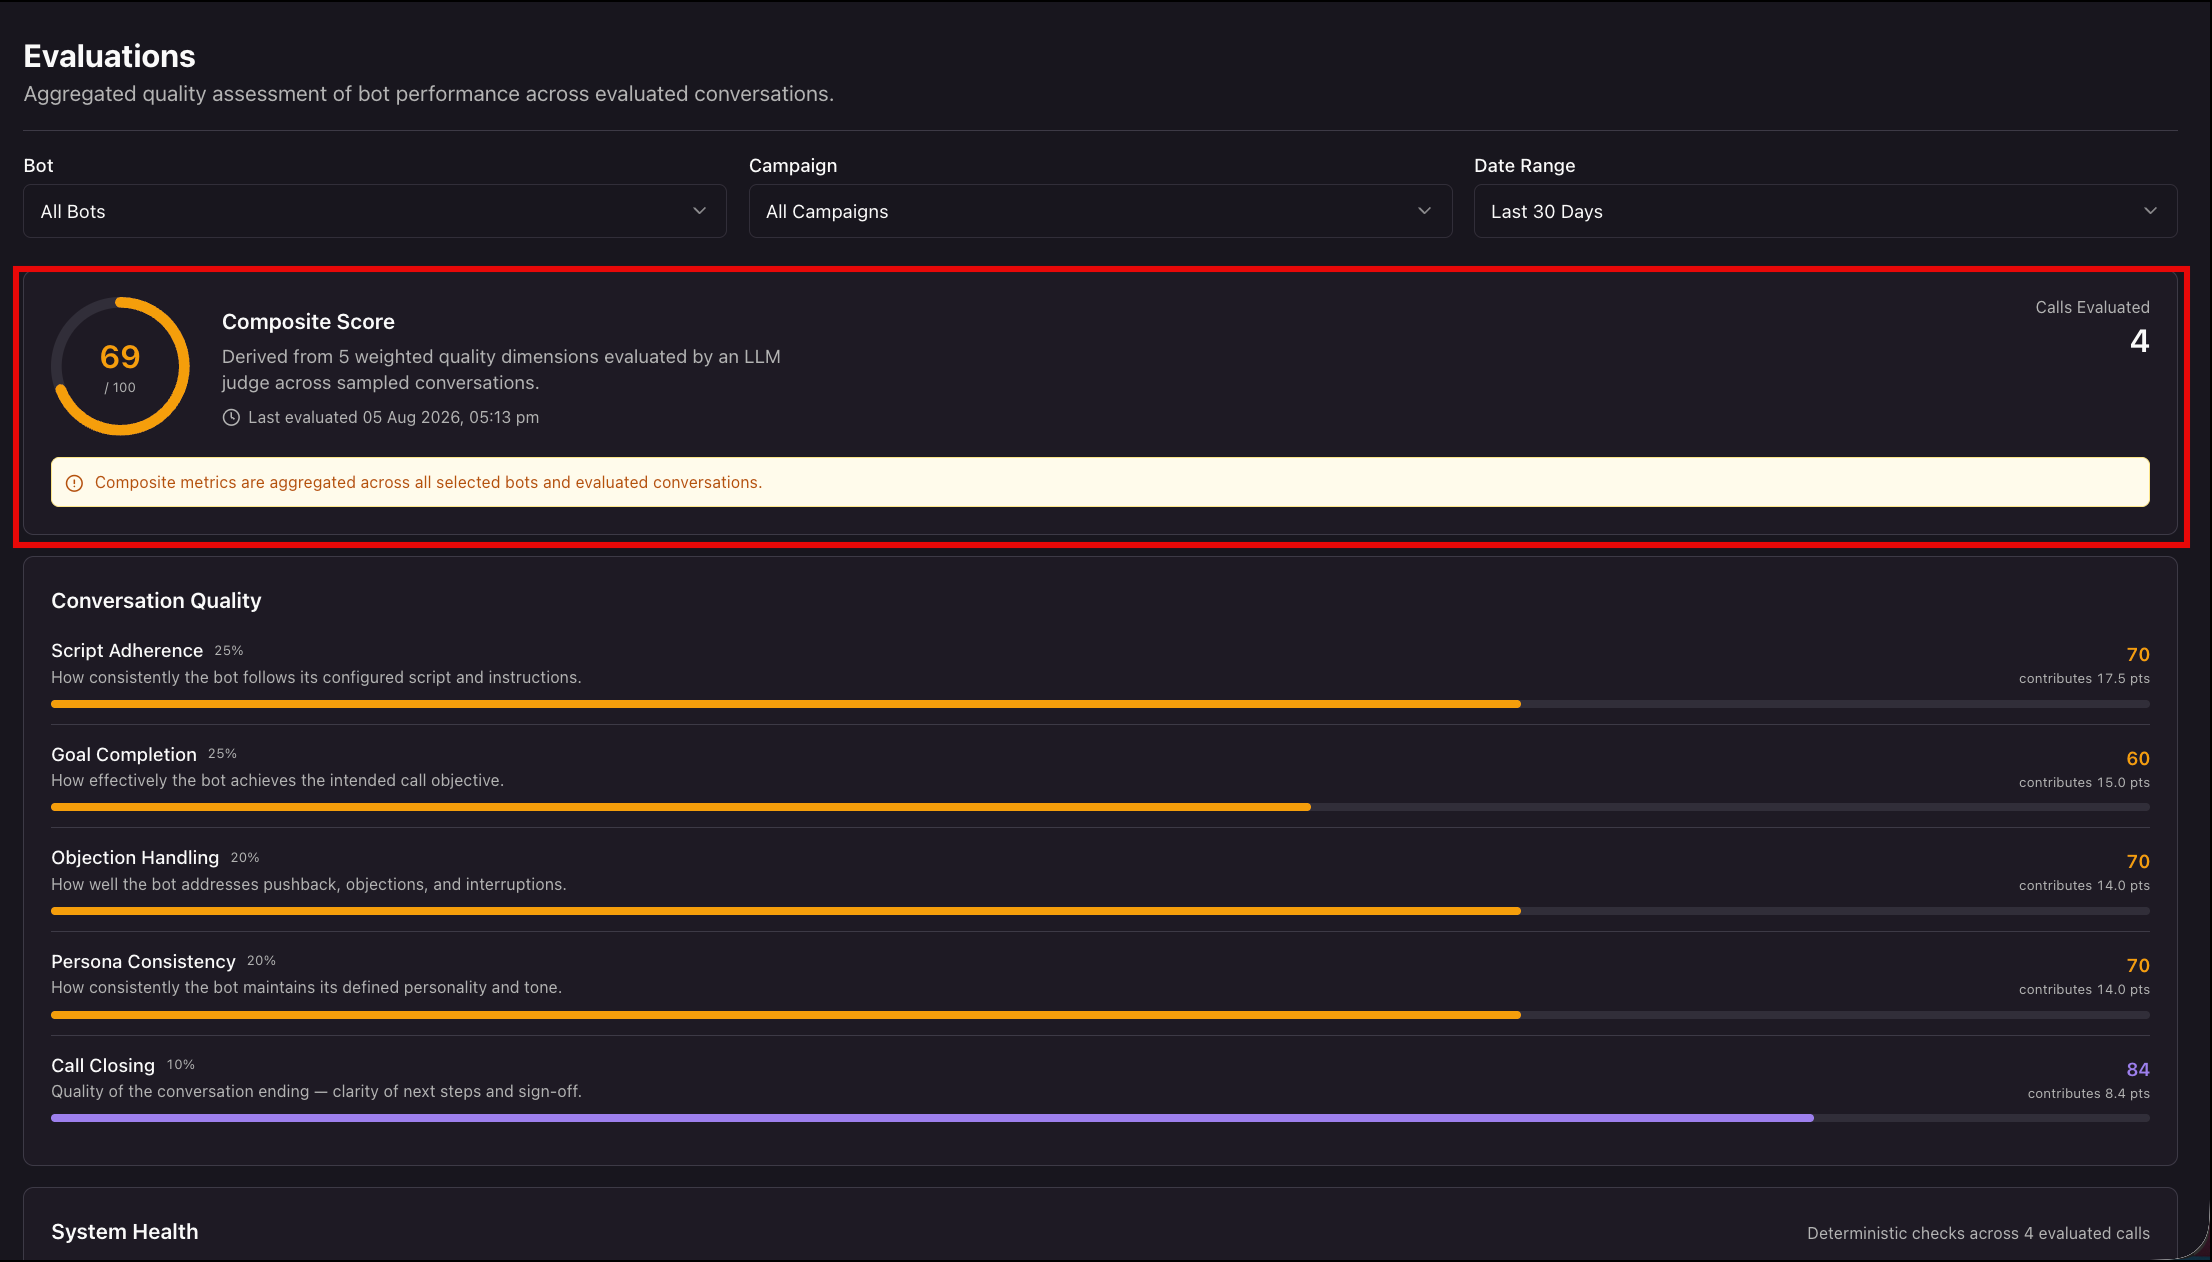
The Composite Score card is the summary of everything below it.
| Element | What it shows |
| Composite Score | The weighted score out of 100 for the current selection. |
| Description | A reminder that the score comes from five weighted quality dimensions judged across sampled conversations. |
| Last evaluated | The date and time of the most recent evaluation run. |
| Calls Evaluated | The number of conversations included in the score. |
6.3 Review Conversation Quality
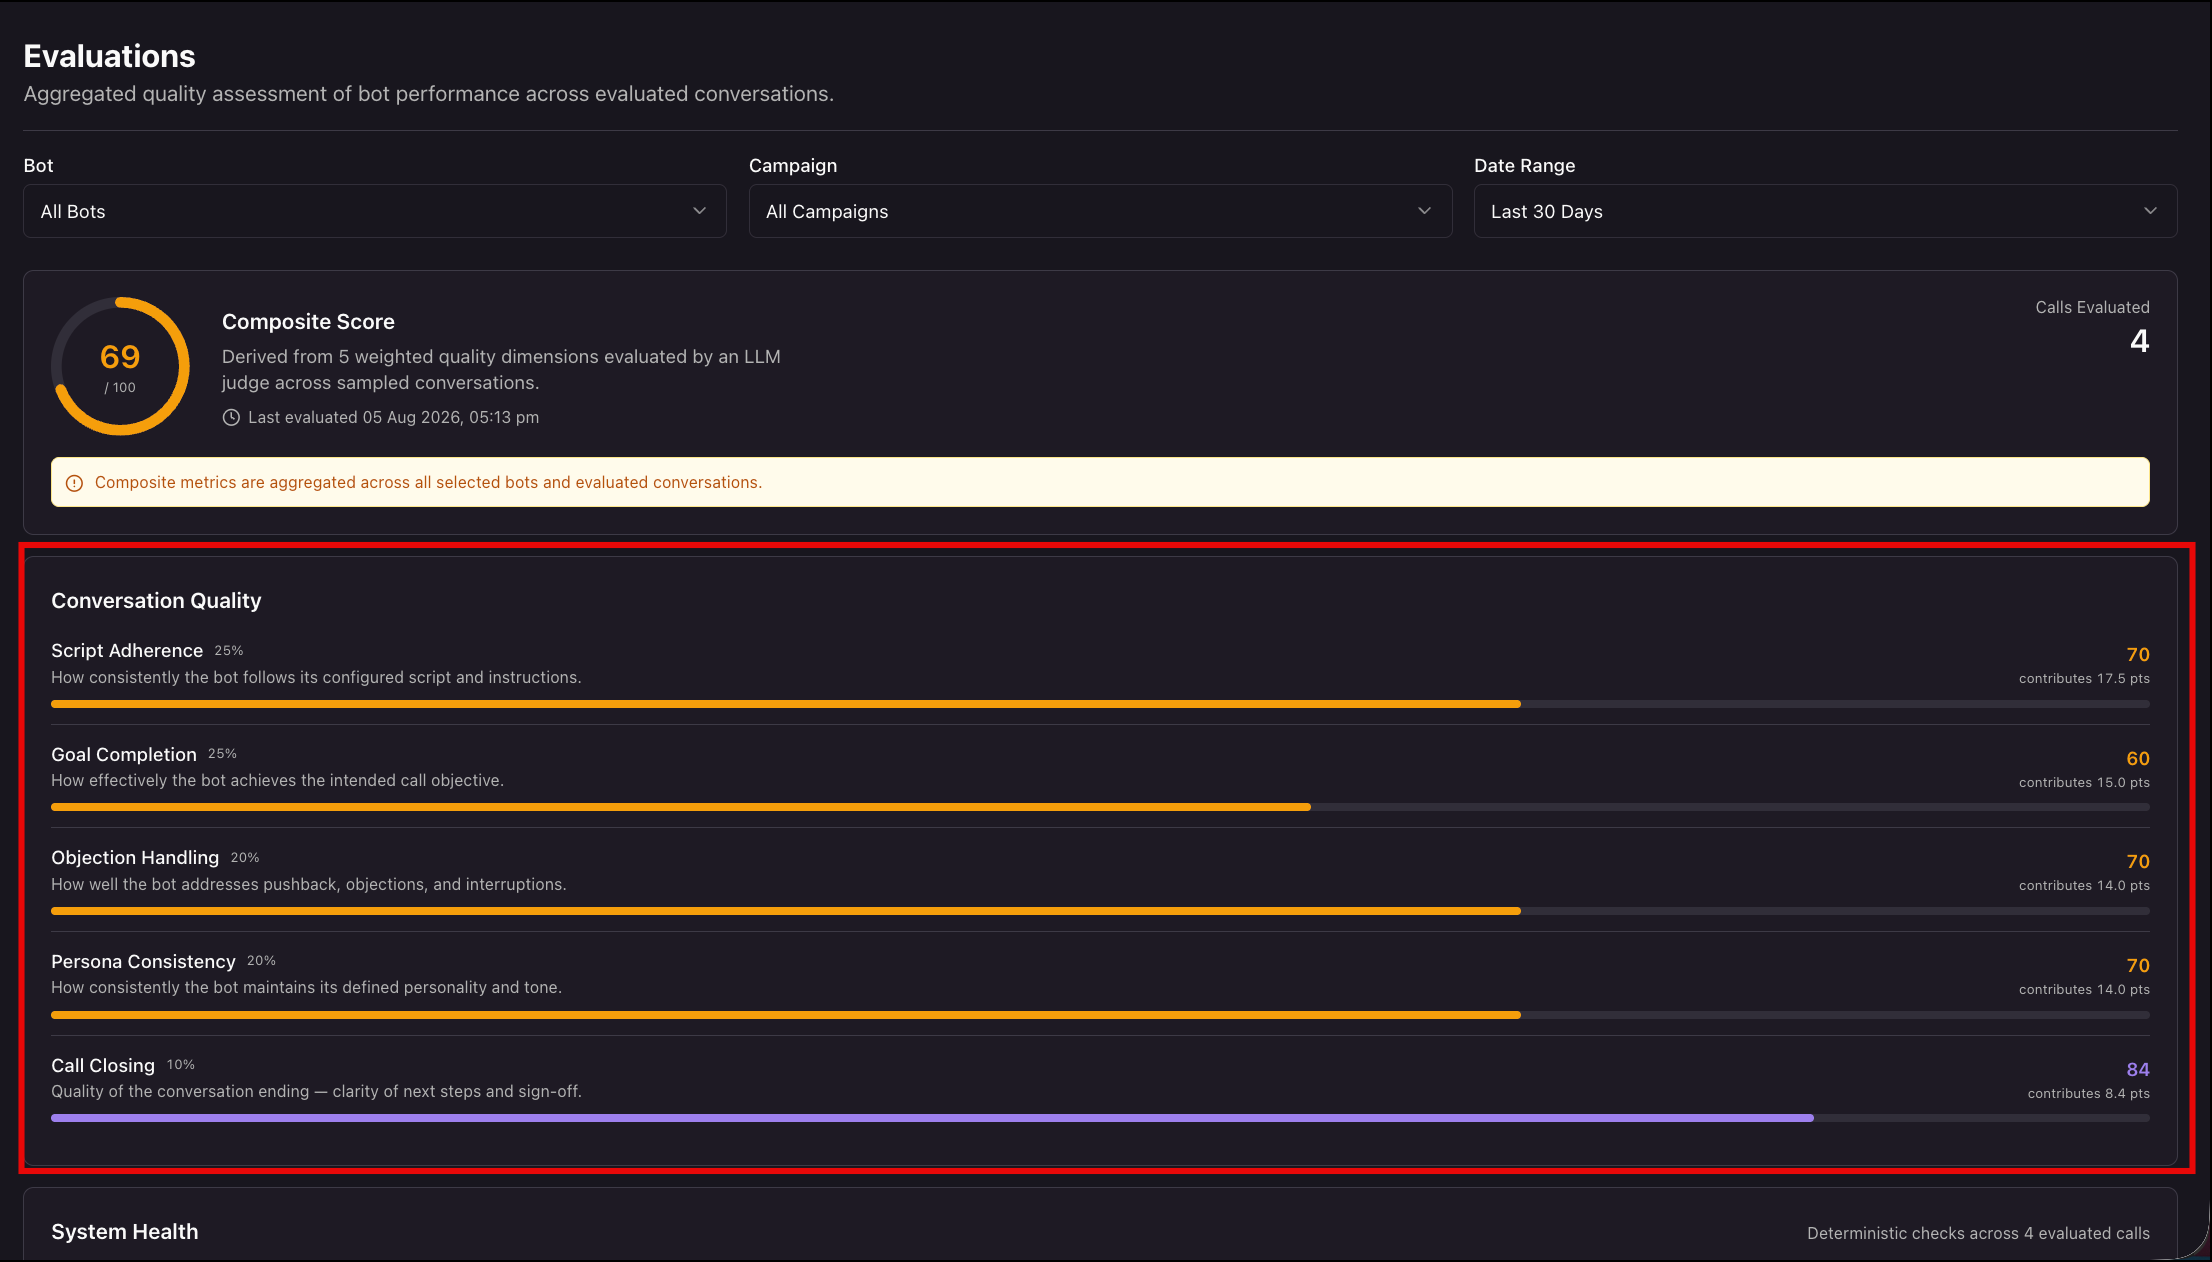
The Conversation Quality panel breaks the composite into its five dimensions. Each row shows the dimension name, its weight, a plain-language description, the score out of 100, a progress bar, and how many points that dimension contributed to the composite.
| Dimension | What it measures |
| Script Adherence | How consistently the bot follows its configured script and instructions. |
| Goal Completion | How effectively the bot achieves the intended call objective. |
| Objection Handling | How well the bot addresses pushback, objections, and interruptions. |
| Persona Consistency | How consistently the bot maintains its defined personality and tone. |
| Call Closing | The quality of the conversation ending, including clarity of next steps and sign-off. |
6.4 Review System Health
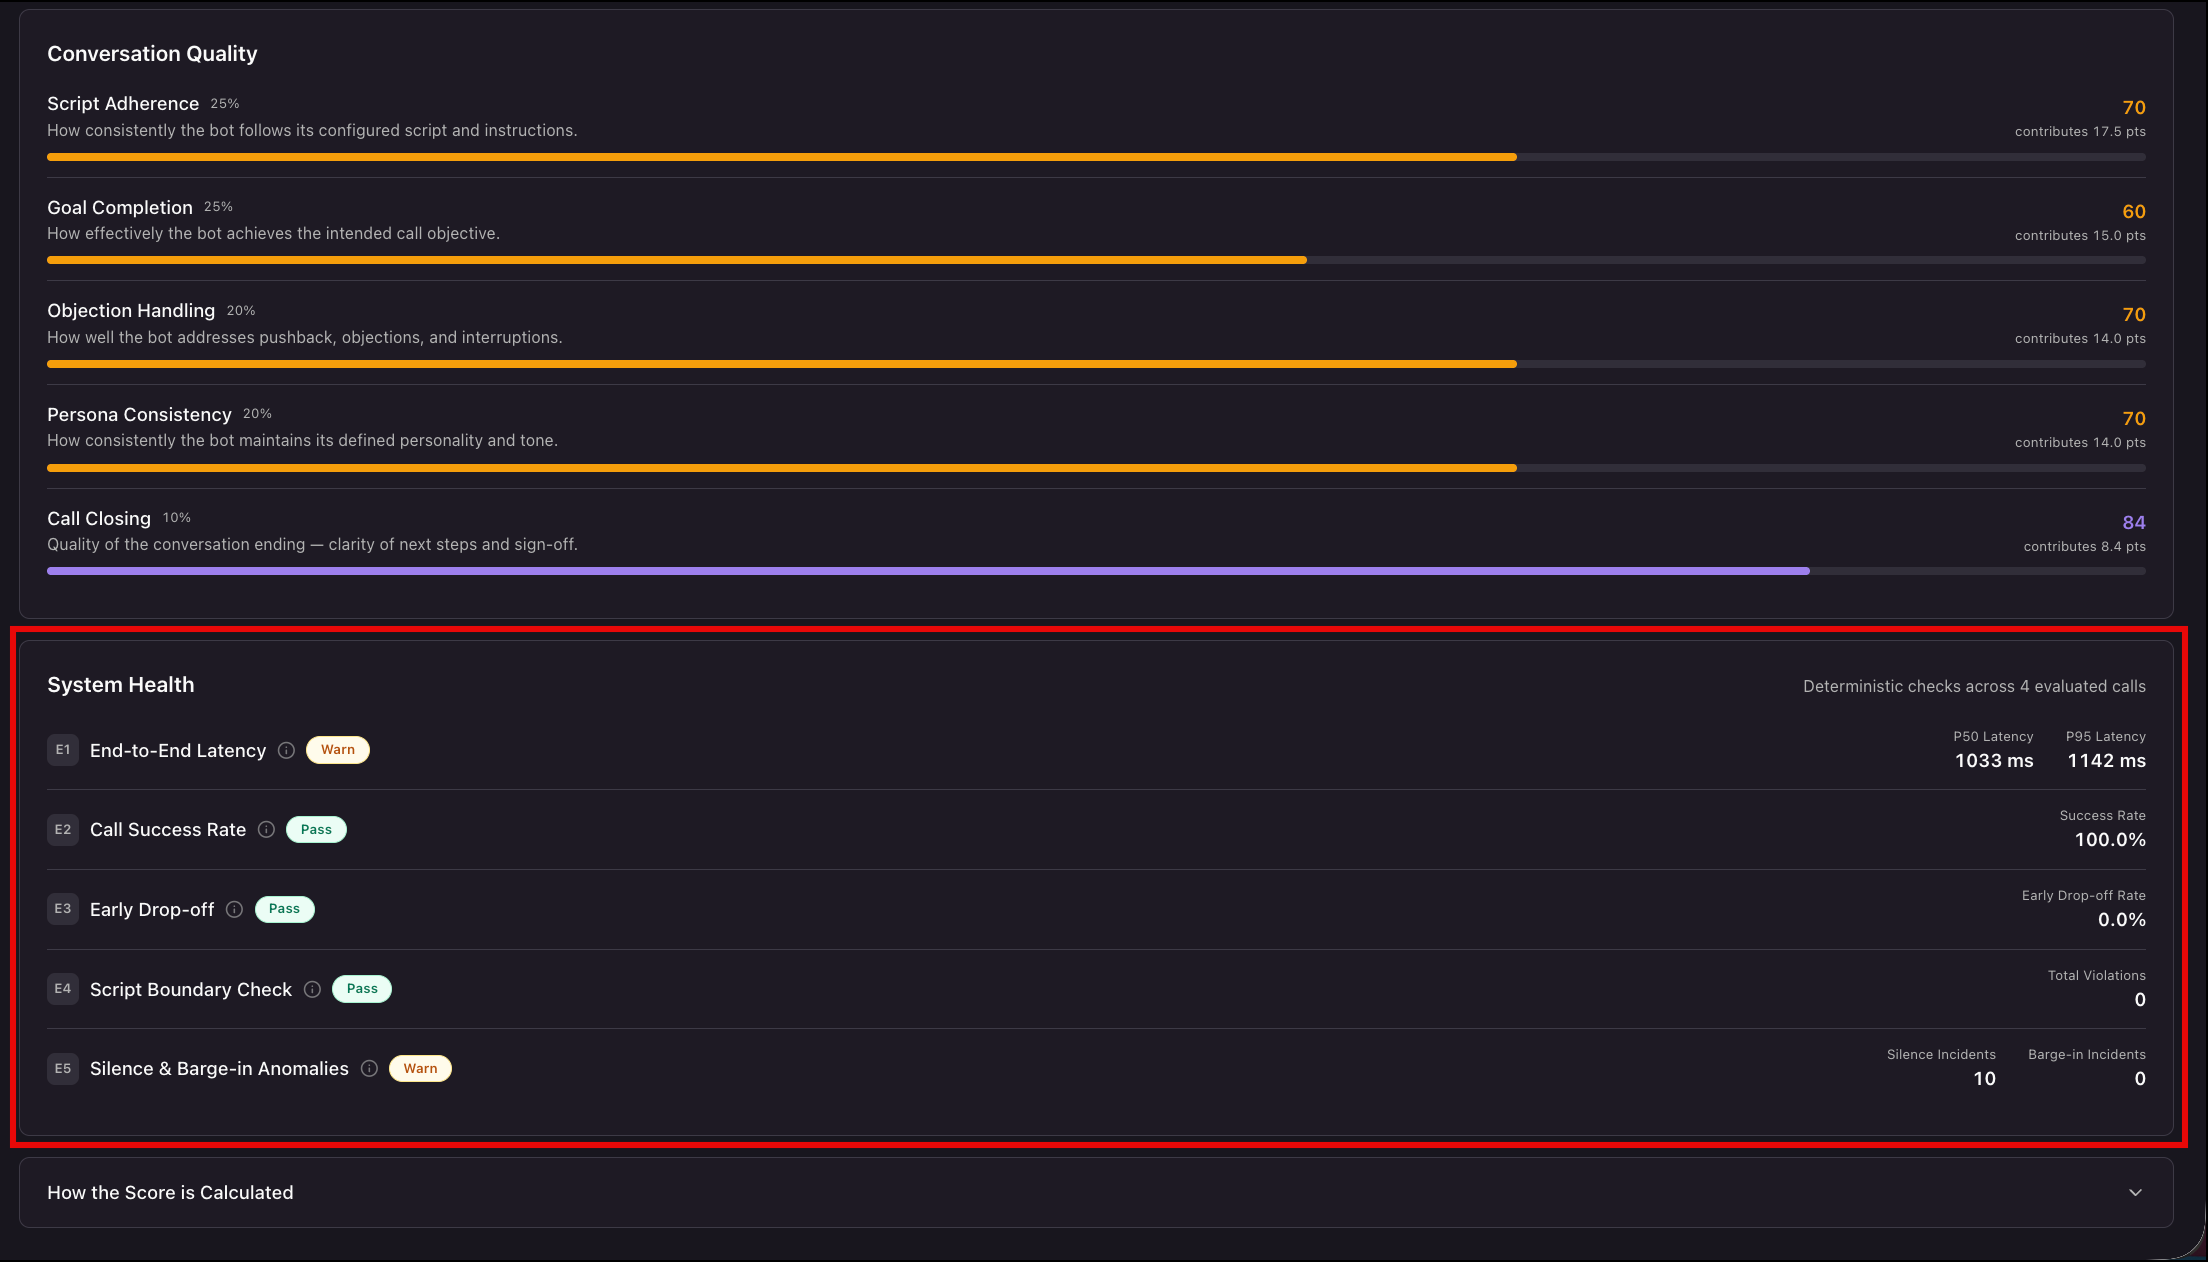
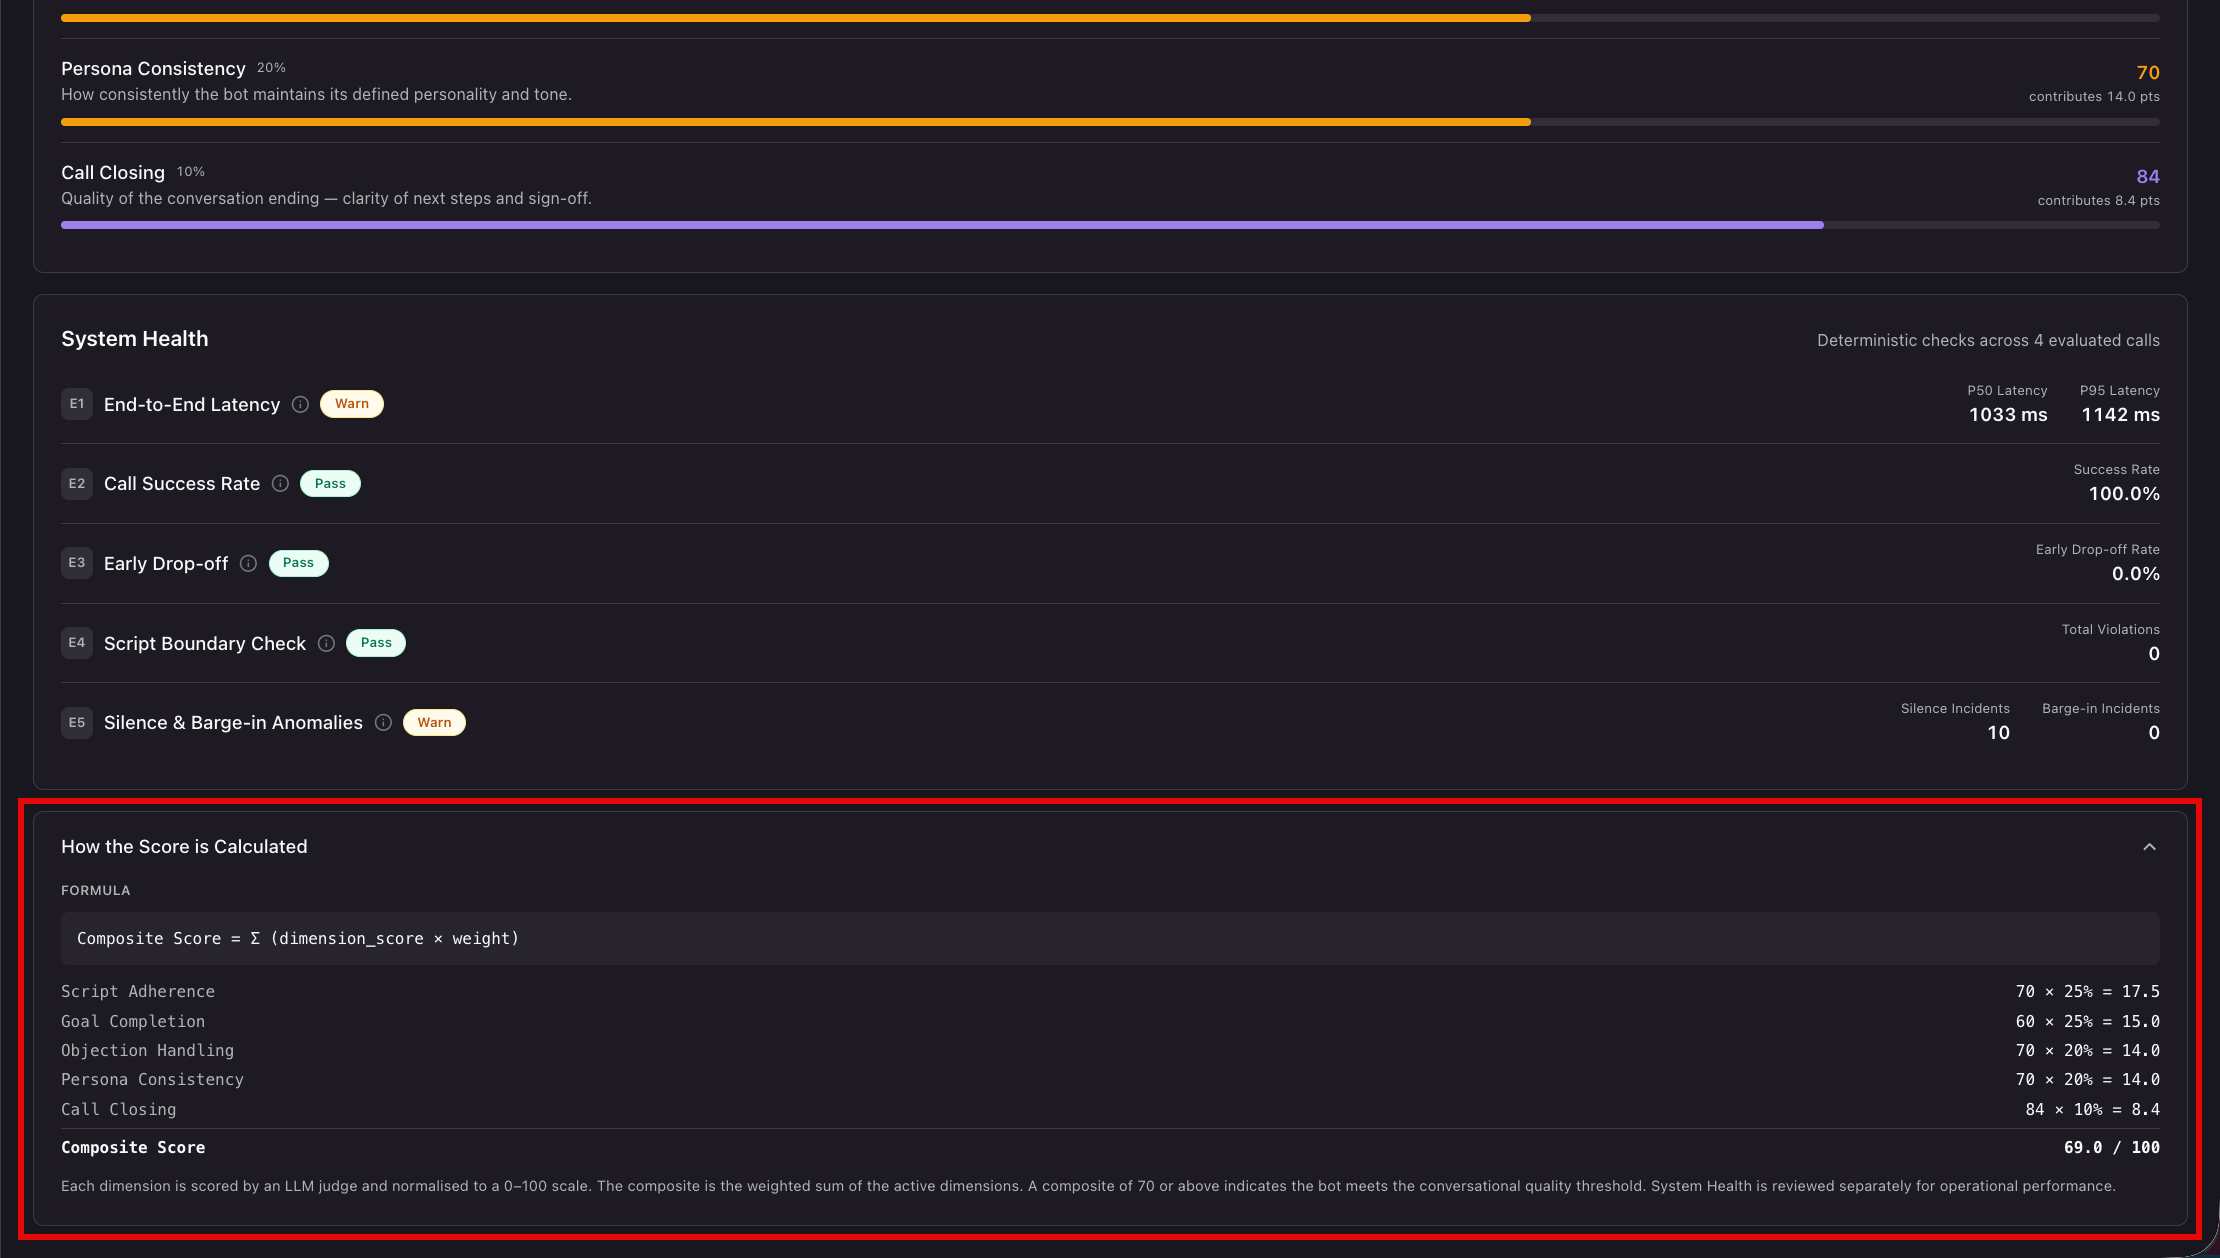
System Health is separate from the quality score. These are deterministic checks run across the evaluated calls, not judgments made by an LLM. Each check has an ID, a status chip, and its own metrics.
| Check | Metrics shown | What it tells you |
| E1 End-to-End Latency | P50 Latency, P95 Latency | How long the bot took to answer, at the median and at the slow end. High P95 means some callers waited noticeably. |
| E2 Call Success Rate | Success Rate | The share of evaluated calls that completed successfully. |
| E3 Early Drop-off | Early Drop-off Rate | The share of calls that ended shortly after they connected. |
| E4 Script Boundary Check | Total Violations | How many times the bot went outside the scope set in its prompt. |
| E5 Silence & Barge-in Anomalies | Silence Incidents, Barge-in Incidents | Long silences in the conversation, and times the caller and the bot spoke over each other. |
The panel header tells you how many evaluated calls the checks ran across. Hover the information icon next to a check to see its definition.
6.7 See How the Score is Calculated
The How the Score is Calculated panel at the bottom of the page shows the arithmetic behind the composite.
- Click How the Score is Calculated to expand the panel.
- Read the formula at the top. The composite is the sum of each dimension score multiplied by its weight.
- Read the rows below the formula. Each row shows one dimension, its score, its weight, and the points it contributed.
- Compare the total against the Composite Score card at the top of the page.
- Click the panel heading again to collapse it.
Any Questions?
Did you find this article helpful? Please let us know any feedback you may have in the comments section below. We’d love to hear from you and help you out!